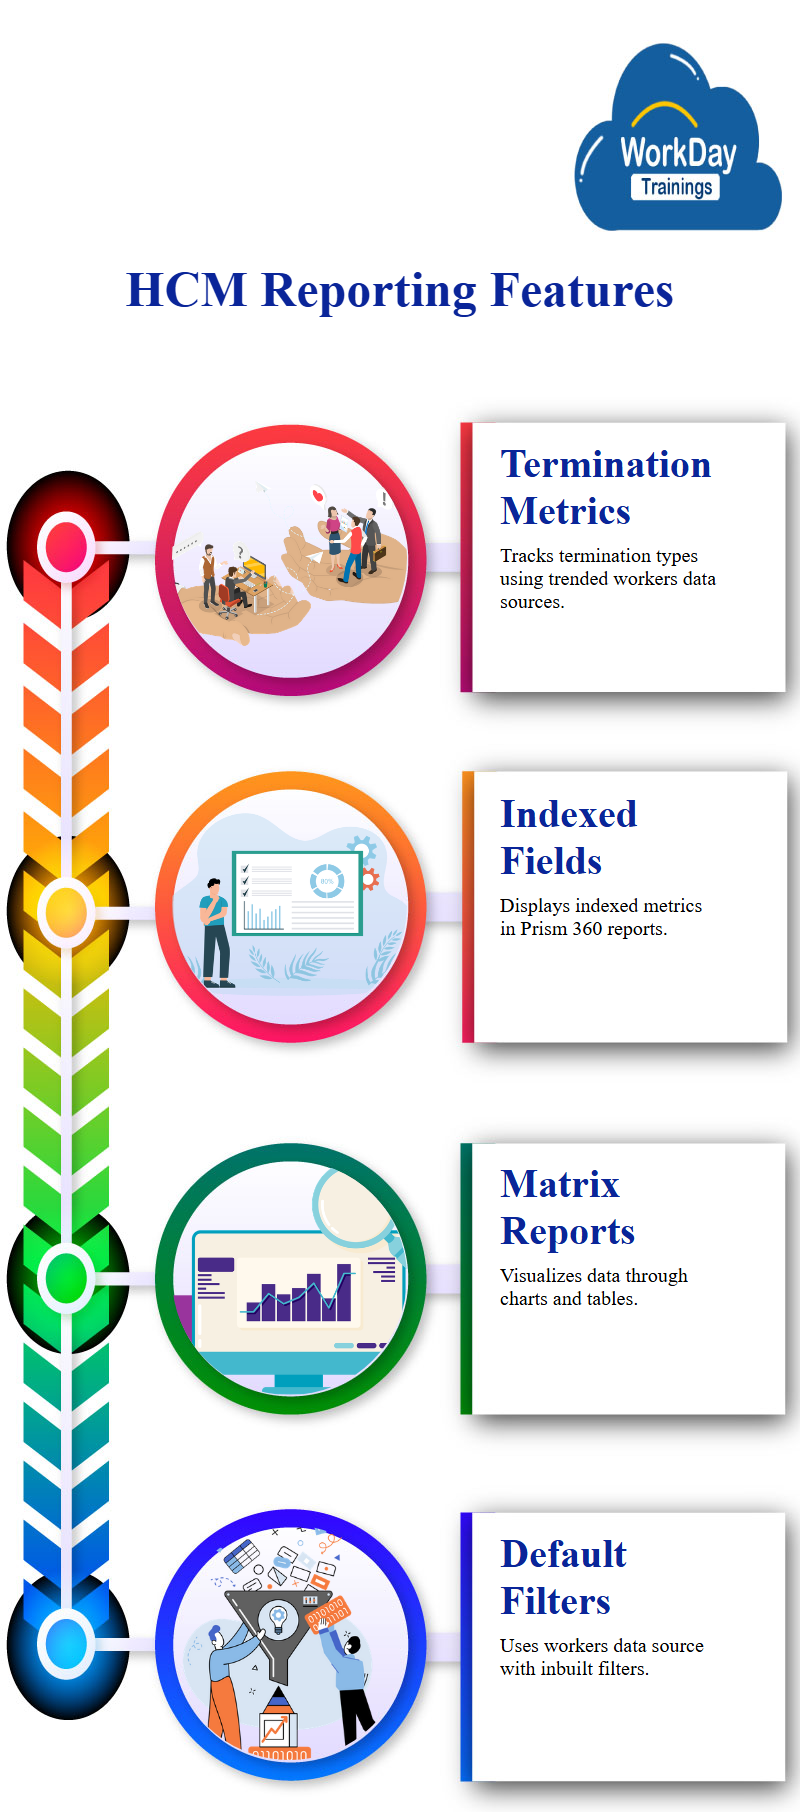
For each time period, the text specifies the desired count of terminations, delivered fields are available on the trended workers data source or business objects, and they are not available on other business objects.
Termination count, involuntary termination count, and voluntary termination count are indexed fields with an orange icon, these fields are available in the index data source and can be displayed in the trending workday Prism 360 Report.
Matrix and Trending Reports in HCM Reporting
A matrix report and trending report can display graphs and charts, with the option to display data in terms of charts or tables, the default filter for these reports is a data source called workers for workday HCM reporting, which has its own inbuilt filters.
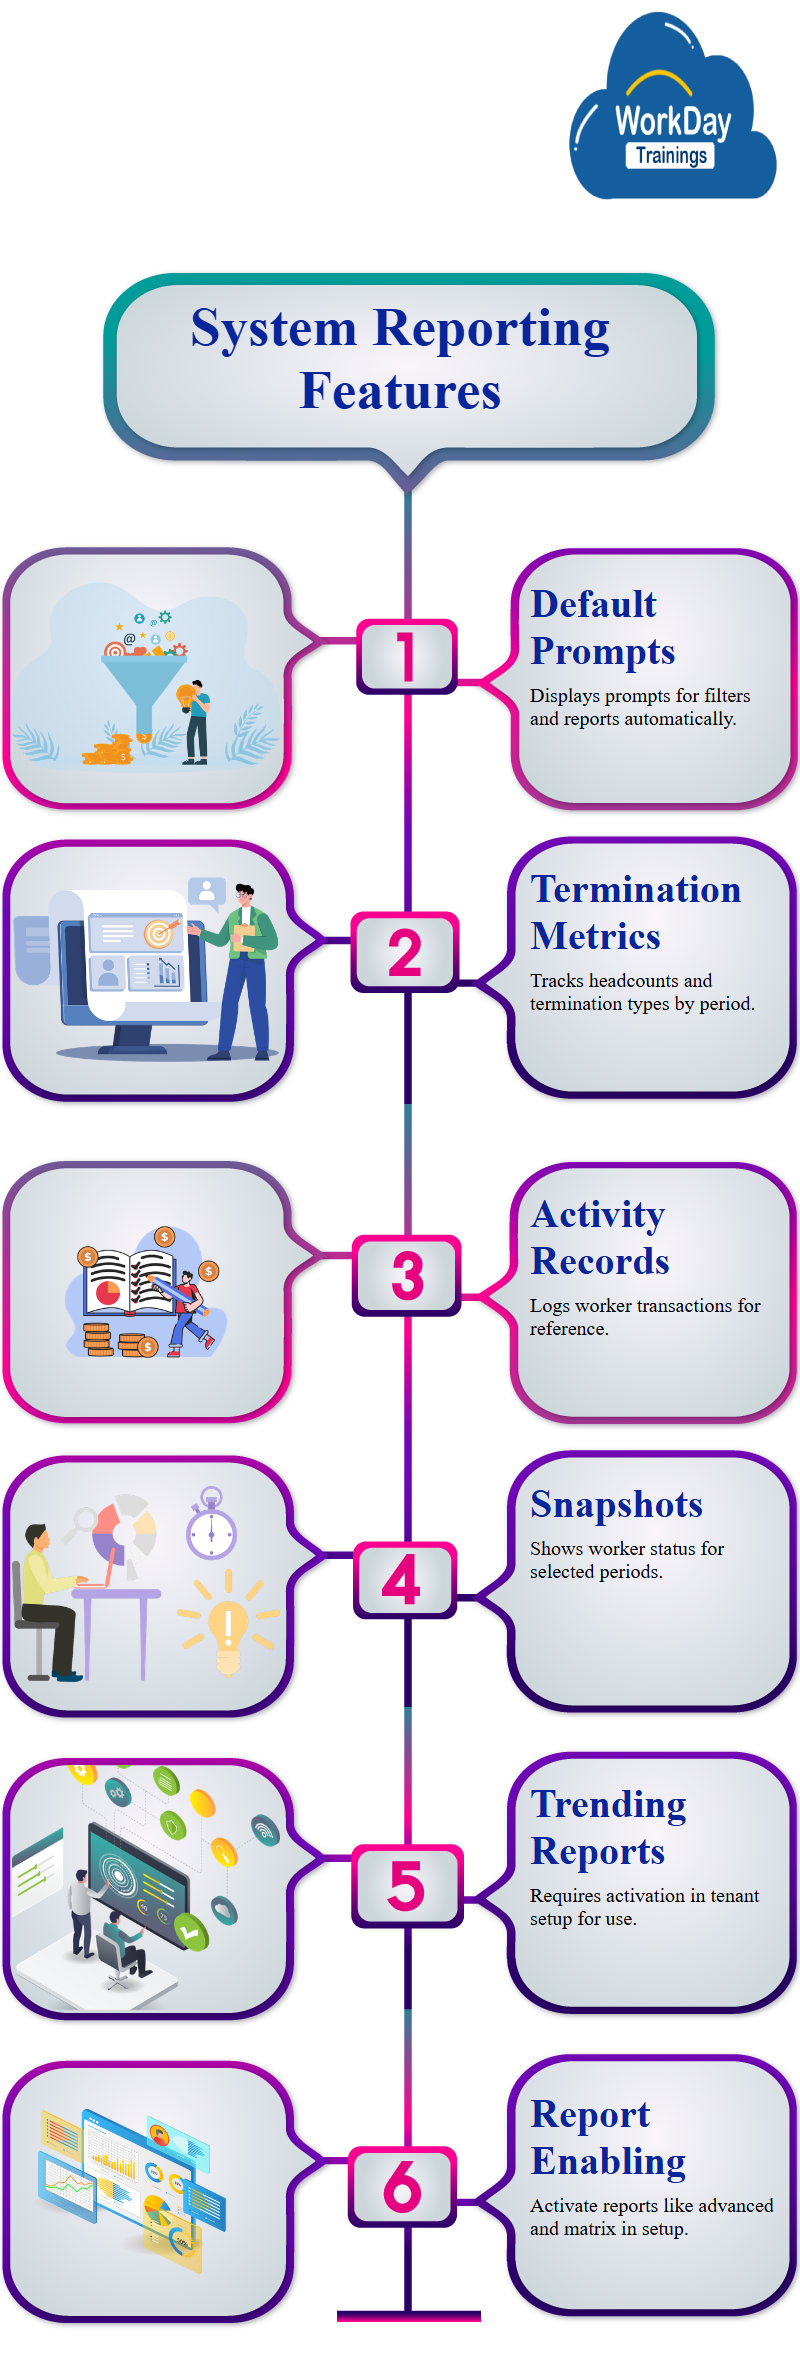
Default Reporting and Tracking in System
The system automatically shows the default prompts for each filter or report, however, for each period, it provides higher counts, termination counts, and ending headcounts.
Activity records include transactions performed on a worker, while snapshots show the status of the worker as of the selected period.
Enabling Trending Reports in workday tenant Setup
To enable trending reports, go to workday tenant setup, reporting and workday analytics, and see that the trending workers data source is not active by default.
To enable other types of reports, such as advanced reports, matrix reports, or other reports, enable this option first. Once enabled, you can check the status of the report.
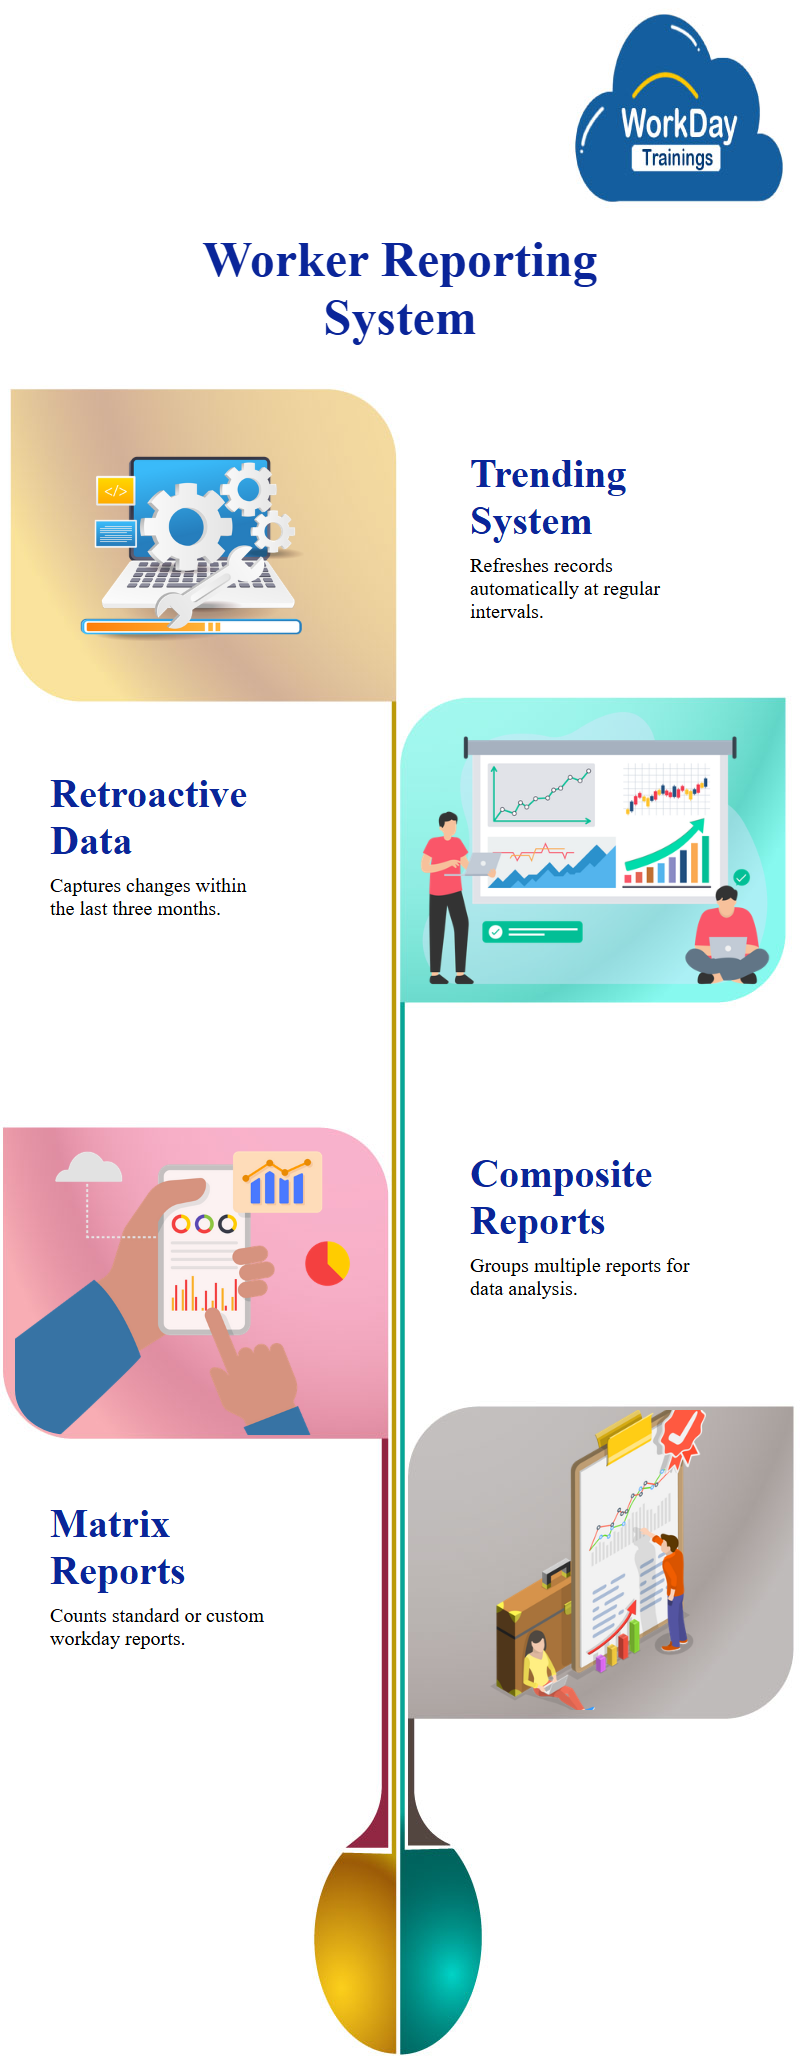
Automated Worker Trending System
A worker trending system that automatically refreshes records at regular intervals, the trending start date is set to last three months, and the earliest date the data will be captured is specified.
The trending period is a minimum granularity on a monthly basis, and the number of retroactive periods is specified, the system can capture late paperwork by going back three months in the past, if the data is beyond three months.
If the data is changed beyond three months, the data will not be captured, the system will automatically check for updates in the last three months when it refreshes in the background.
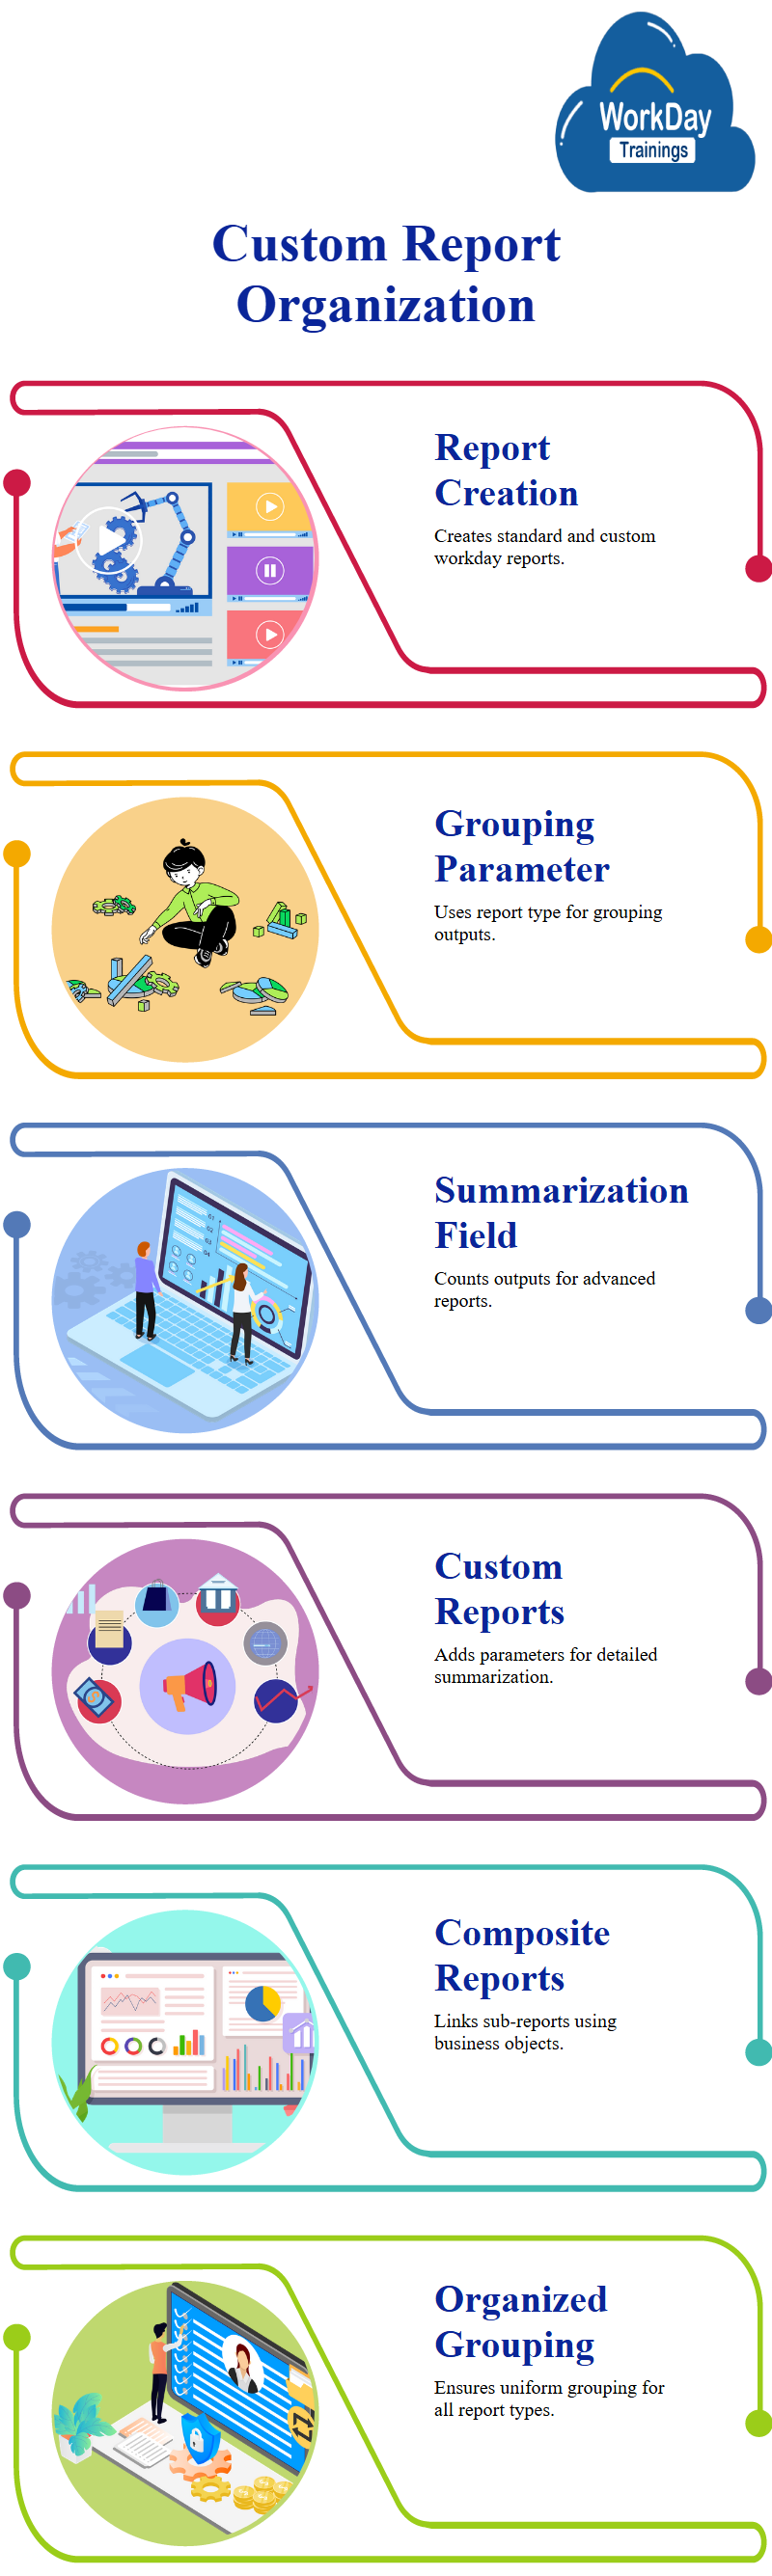
The Composite Report: Grouping Reports for Counting and workday analysis
A composite report is a workday Prism review tool that allows users to group one or more reports, such as matrix reports, based on their report type.
For example, a matrix report can be created to count the number of workday standard reports, while a matrix report can be created to count all workday custom reports.
Custom Report Creation: Advanced workday analysis and Customization
Users creates a new workday custom report a sub report named ZF, they create two reports, one for standard reports and one for workday custom reports.
The grouping parameter is the report type, and the summarization field is used to count outputs, the total count for advanced is 2244.
For workday custom reports, additional parameters or summarizations are added, such as a count for workday standard reports without a temporary workday standard report.
Effective Report workday organization in Composite Reporting
When creating a composite report, the business object should be the report type, which links all sub reports used on the composite report, this is because the primary workday business objects for both reports is the custom report, while the primary workday business objects for all standard reports is the standard report.
The grouping field for both reports, standard and custom, is the report type, and the grouping is the same for both types, this ensures that the composite report is organized and organized effectively.
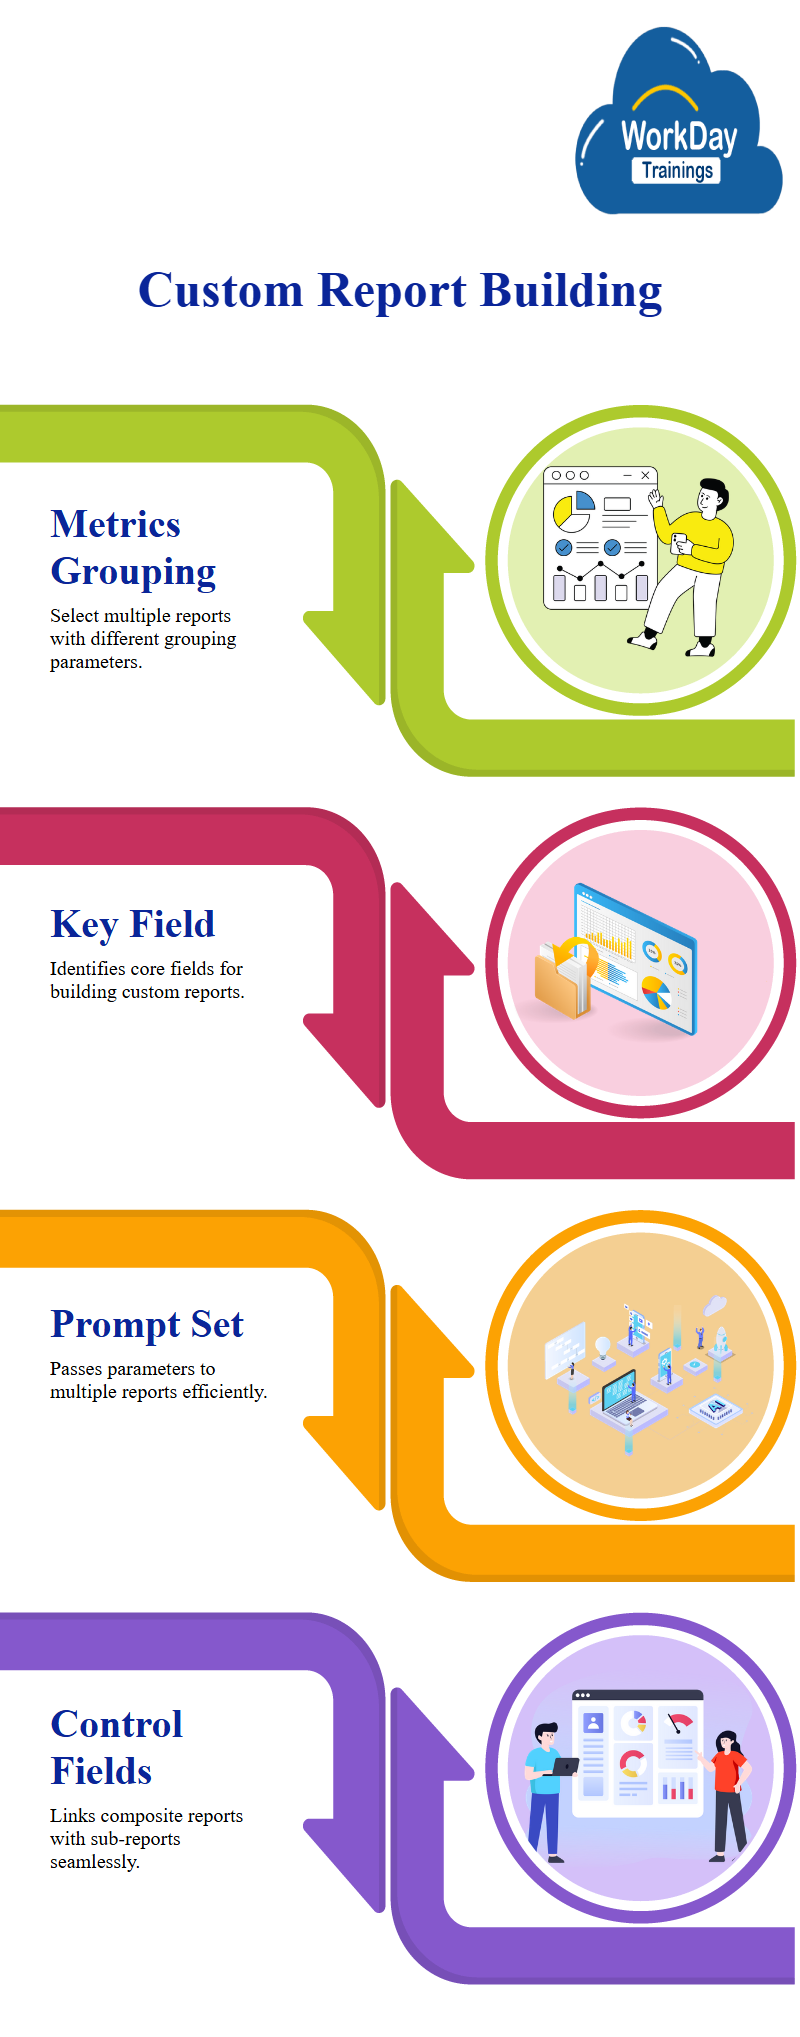
Custom Report Building with Multiple Metrics Reports and Prompt Sets
If two metrics reports have different groupings, such as country or state, you must select both report types, if there are multiple reports with different grouping parameters, all must be selected.
Identifying a key field is the primary task when building a custom report, to pass parameters to multiple reports through a common set on the composite report, create a prompt set.
This allows you to pass parameters to multiple reports without passing them separately on each report, you can define the prompt set if desired.
Defining Control Fields for Composite Reports
The prompt set gear icon is optional and only required when all reports have similar selection parameters, when selecting a report type as the business object on a composite report, a control field is defined to link the composite report with its sub reports.
The control field is reporting type, as it allows linking the composite report to both sub reports. Regardless of the business object or number of business objects selected, control fields must be defined.
Pulling data from multiple reports in Workday
The default control type in Workday is due to selecting only one business object, to change this, the user can name a column, such as ABC, and select report type as the control field.
This allows the user to select sub reports based on the control field, which will pull data from the custom report, the next column is the data field, which will be called standard reports. These sub reports will only be available if they have the same grouping field as the selected control fields.
Workdays only shows three or four reports due to their grouping by field, the first report has one summarization, count, to aggregate data from the sub report, define the count in the data column.
Add data from the second custom report, which is custom reports in the workday tenant, the second sub report has two summarizations: count and temporary count, the fields to aggregate are defaulted to count, but the second report has two summarizations: count and temporary count.
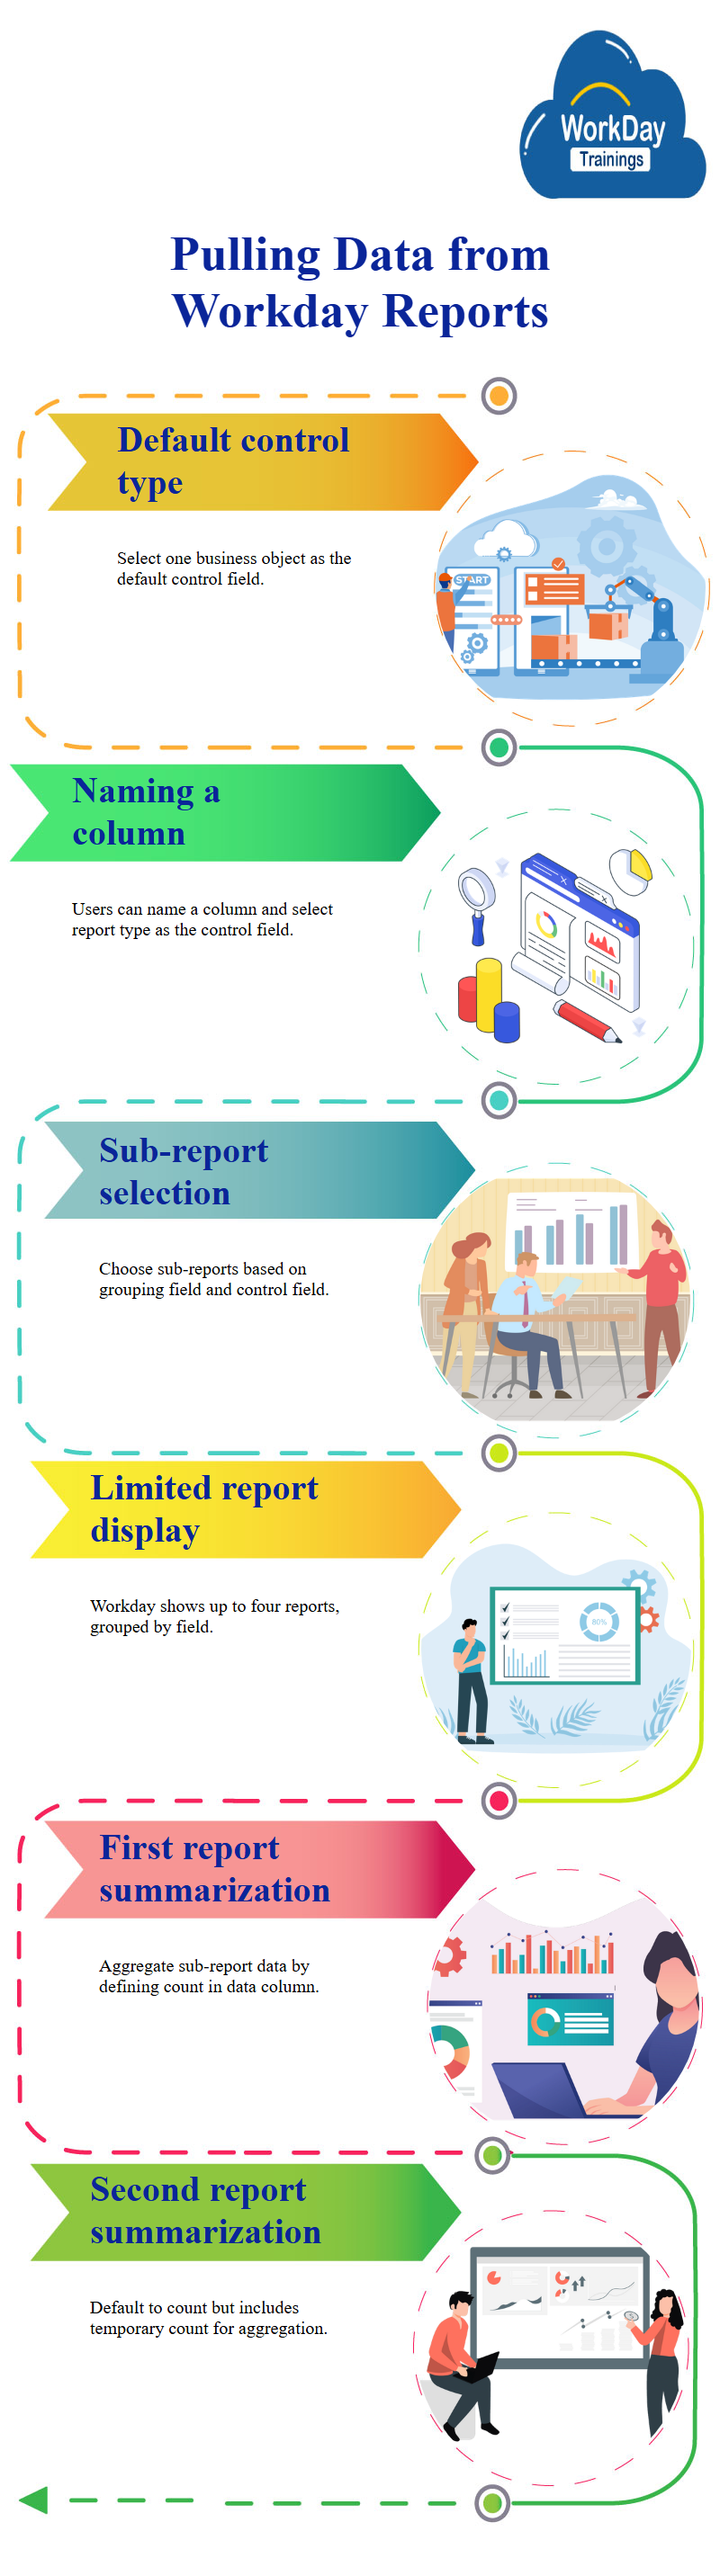
The two summarizations: count and temporary count, the first is a control field, while the second is defining data, two data columns are created: one for standard reports and the other for custom reports.
Users can edit these columns, delete them, or create duplicates, a composite report is created, pulling data from two sub reports simultaneously, the first sub report shows all standard reports, while the second sub report shows all custom reports.
The data is defined at the column level, and the total of transposed reports is 43, to calculate the total, the text defines a control field and calculates the number of reports by adding an empty column to create a gap.
The total is then calculated by adding the total number of reports to the control field. The handbook emphasizes the importance of defining data at the column level for efficient data management.
Formatting and Calculating Report Counts in Excel
To add a gap for formatting, you can add an empty column, to calculate the total count or total report count, click on “define” and then “empty”.

The calculation options include finding the difference, dividing, multiplying, finding percentages, summing-up, and sum range.
The system has added an empty column to the total report count, resulting in a total of 43 and 22, the composite report allows for additional formatting, such as adding an empty column. Users also wants to get the sum of temporary reports from a custom report.
Customizable Composite Reporting with Row and Column Formatting.
Composite is created for specific options only available in it, a report header style is created, and the total count is added to it.
Standard and custom styles are available, and users can define their desired formatting, the total count style is blue and blank when zero, or a cash total style.
The rows are used for formatting updates, style can be applied to any column, and the total count is now displayed as a blank.
The default data from custom reports is directly pulled into the composite report. Any additional formatting or filtering can be done at the row level or column level, for example, to get the column total, one can define options at the row or column level.
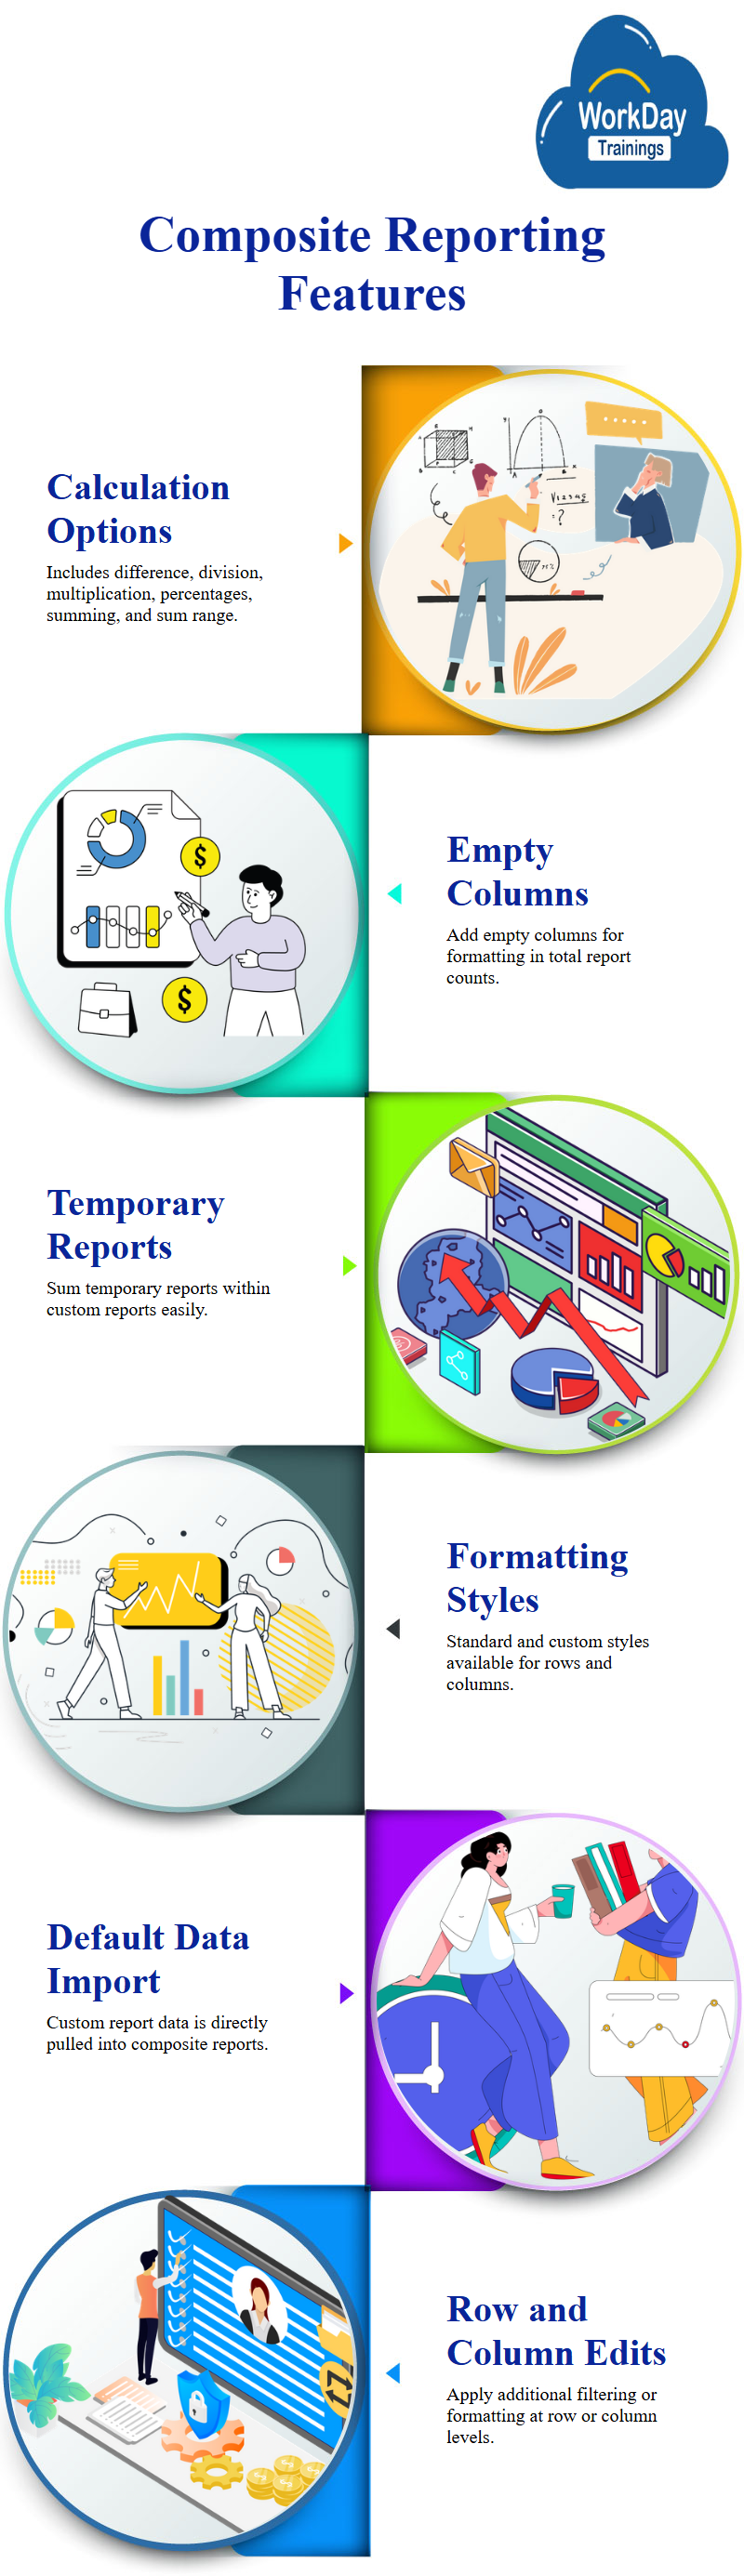
To compare the report side by side, one can open it in a separate tab and run it, filtering can be done at the row level or column level, allowing for the definition of lookup data for advanced and composite reports.
Customizing Lookup Data in Workday
Lookup data is similar to VLOOKUP or any filter that can be defined, it allows calculations, inserting empty fields or rows, and includes advanced report type. Workday pre-populates this key field for you.
To include other report types, edit the selection list and add both advanced and simple report types, the current filter only provides data for advanced report type, so adding any other filter would not be useful.

Harsha
New Technology, let's explore together!

