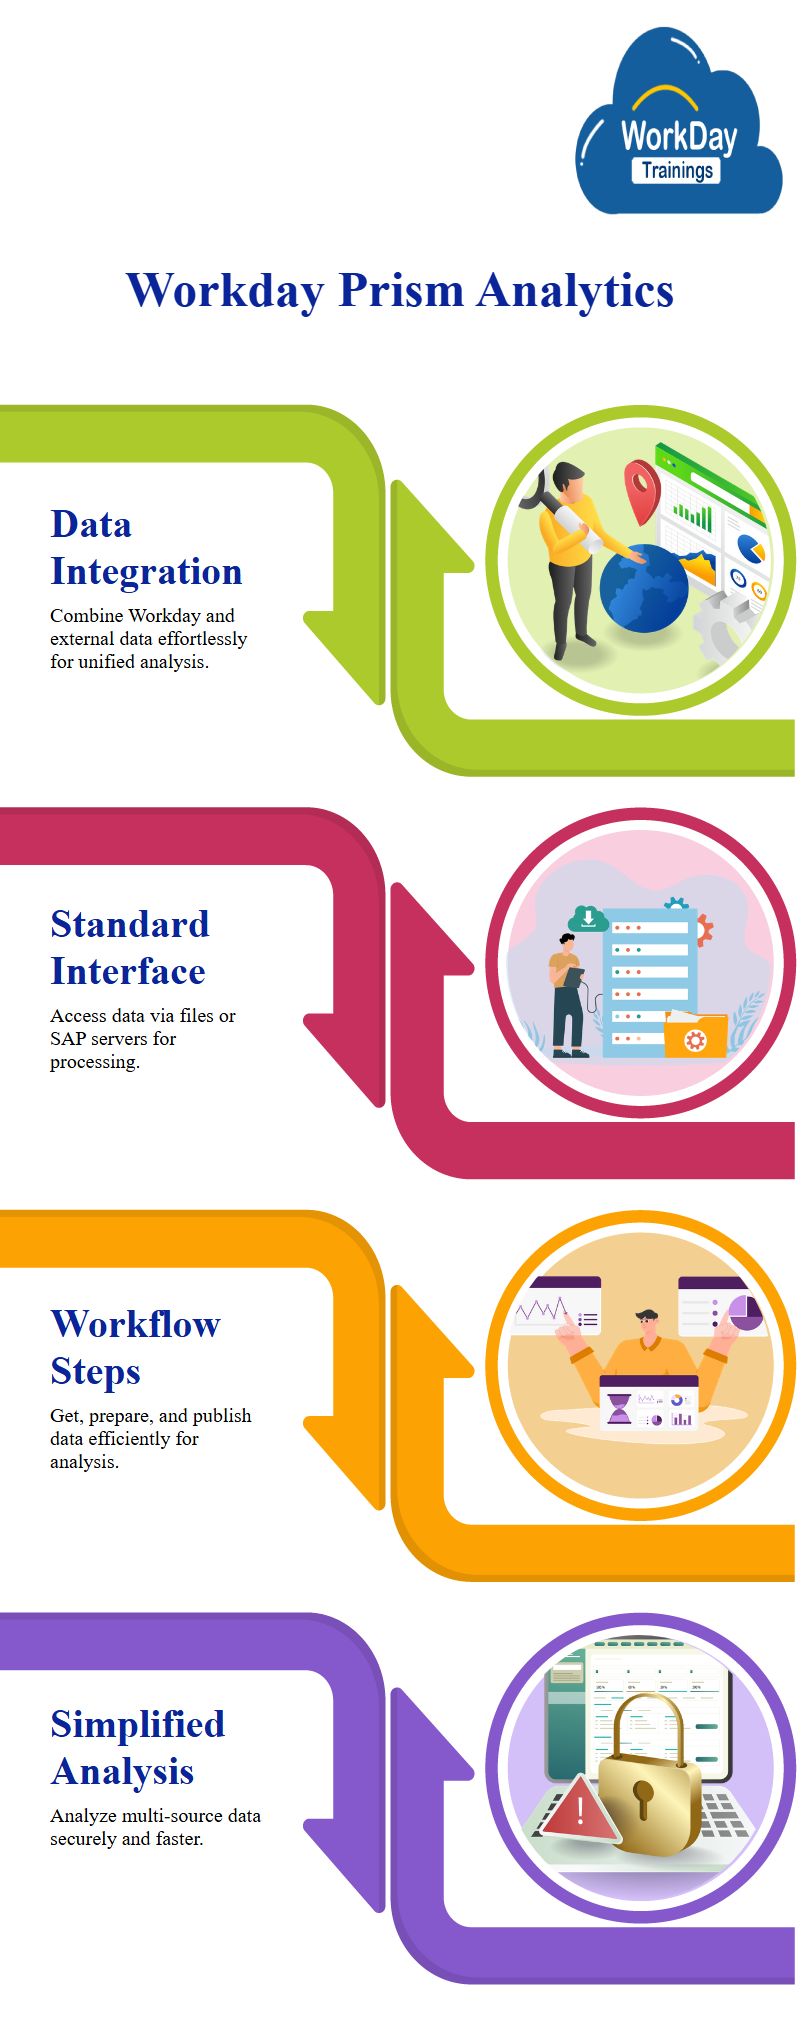
Workday Prism analytics is a solution that enables data administrators, analysts, and consultants to analyse workday and non-workday data together, this allows them to bring data from different sources, simplifying the process of building integrations for different third-party systems.
Workday prism analytics software a standard interface for obtaining data, either through files or SAP servers.
The workflow for Prism analytics is simple, consisting of three steps: getting data from workday or external sources, preparing data for final analysis, and publishing the data, the first step involves getting data, which can be from workday or external sources.
The second step is preparing the data, which involves blending data from different sources, transforming it, applying prism calculations, applying security permissions, performing unions and joins, and performing various data transformation steps.
The third step is publishing the data, which is then ready for analysis through Workdays, reporting, and Discovery Board capabilities, this simplifies the process of bringing data from multiple sources and analysing it together, making it faster, easier, and more secure.
The Prism workflow is designed to adhere to Workday’s configurable security framework, ensuring that data from non-workday sources is protected and analysed efficiently.
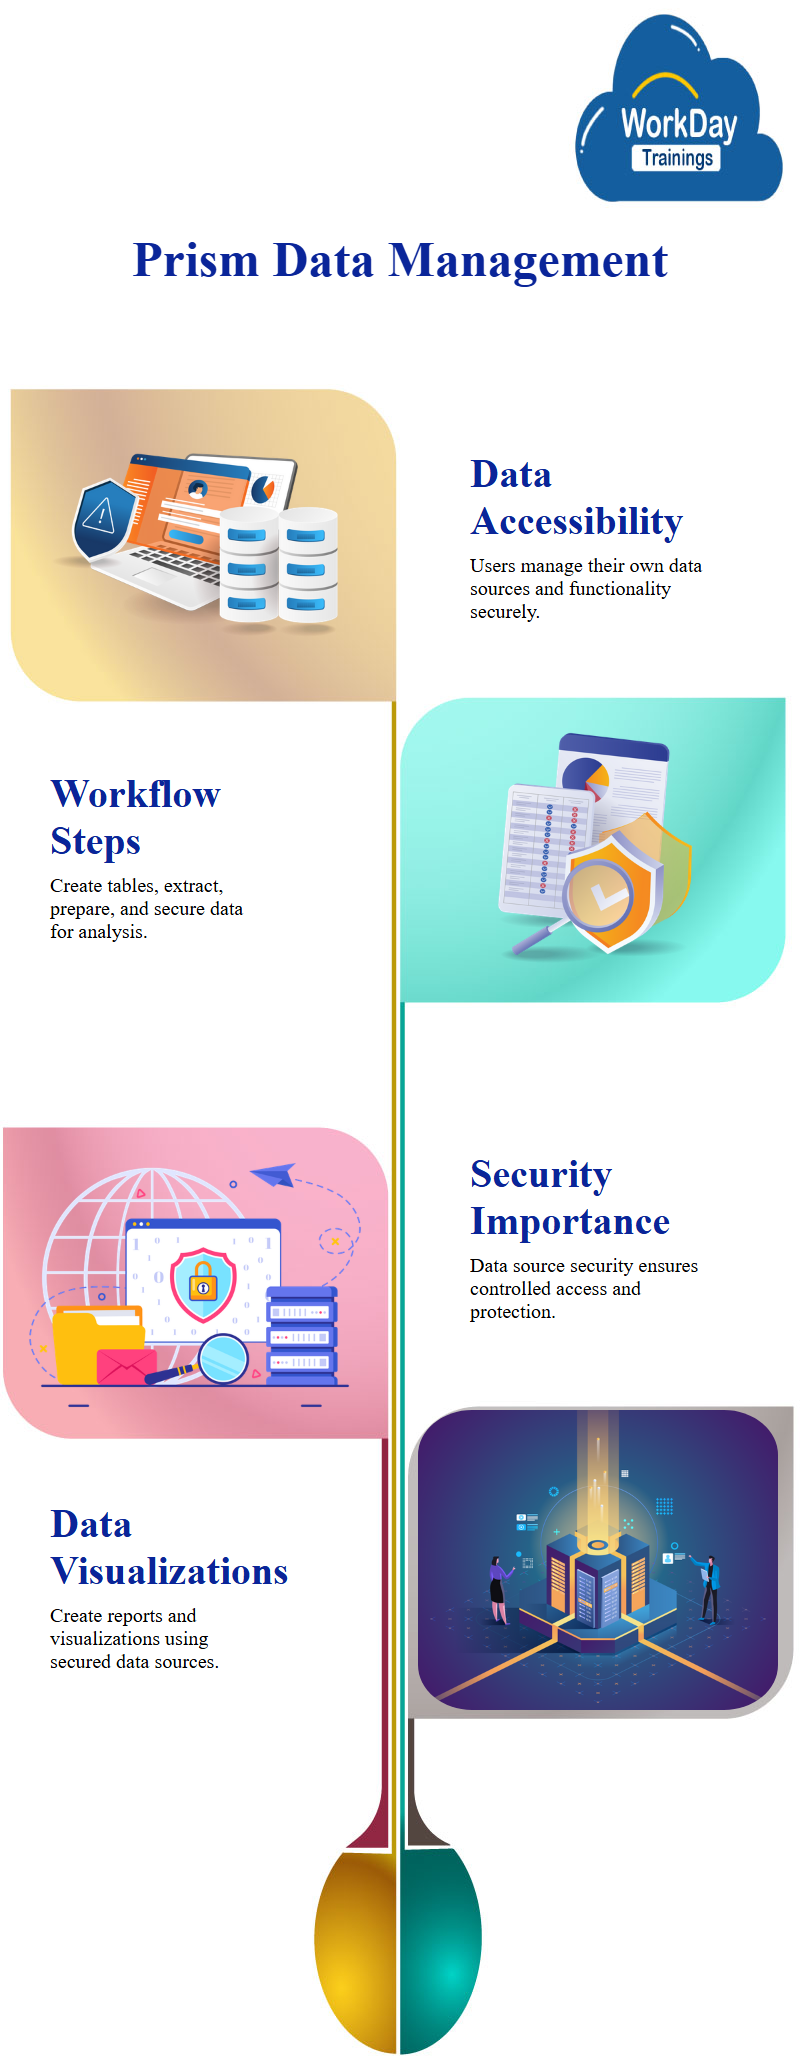
The prism setup steps involve enabling prism analytics, which is a module that allows users to manage their own data sources and functionality, to enable prism analytics, users must first enable the workday tenant for prism workday analytics, which depends on their purchase and subscription agreement.
It has divided its solution into different functional areas, such as HCM, compensation, and payroll, once enabled, the workday tenant can be activated for specific modules, such as workday prism analytics tutorial.
Prism Analytics Data Management Workflow
Activating a functional area is not a security job, but rather a security job that requires understanding the associated security setup, users should maintain functional areas once the functional area is enabled, and then set up relevant security groups and permissions.
Creating job-based or workday integration security groups is not allowed for prism domains, to enable prism analytics, users must define three simple steps: enable the tenant for workday prism analytics demo, activate the relevant security groups and permissions, and maintain functional areas.
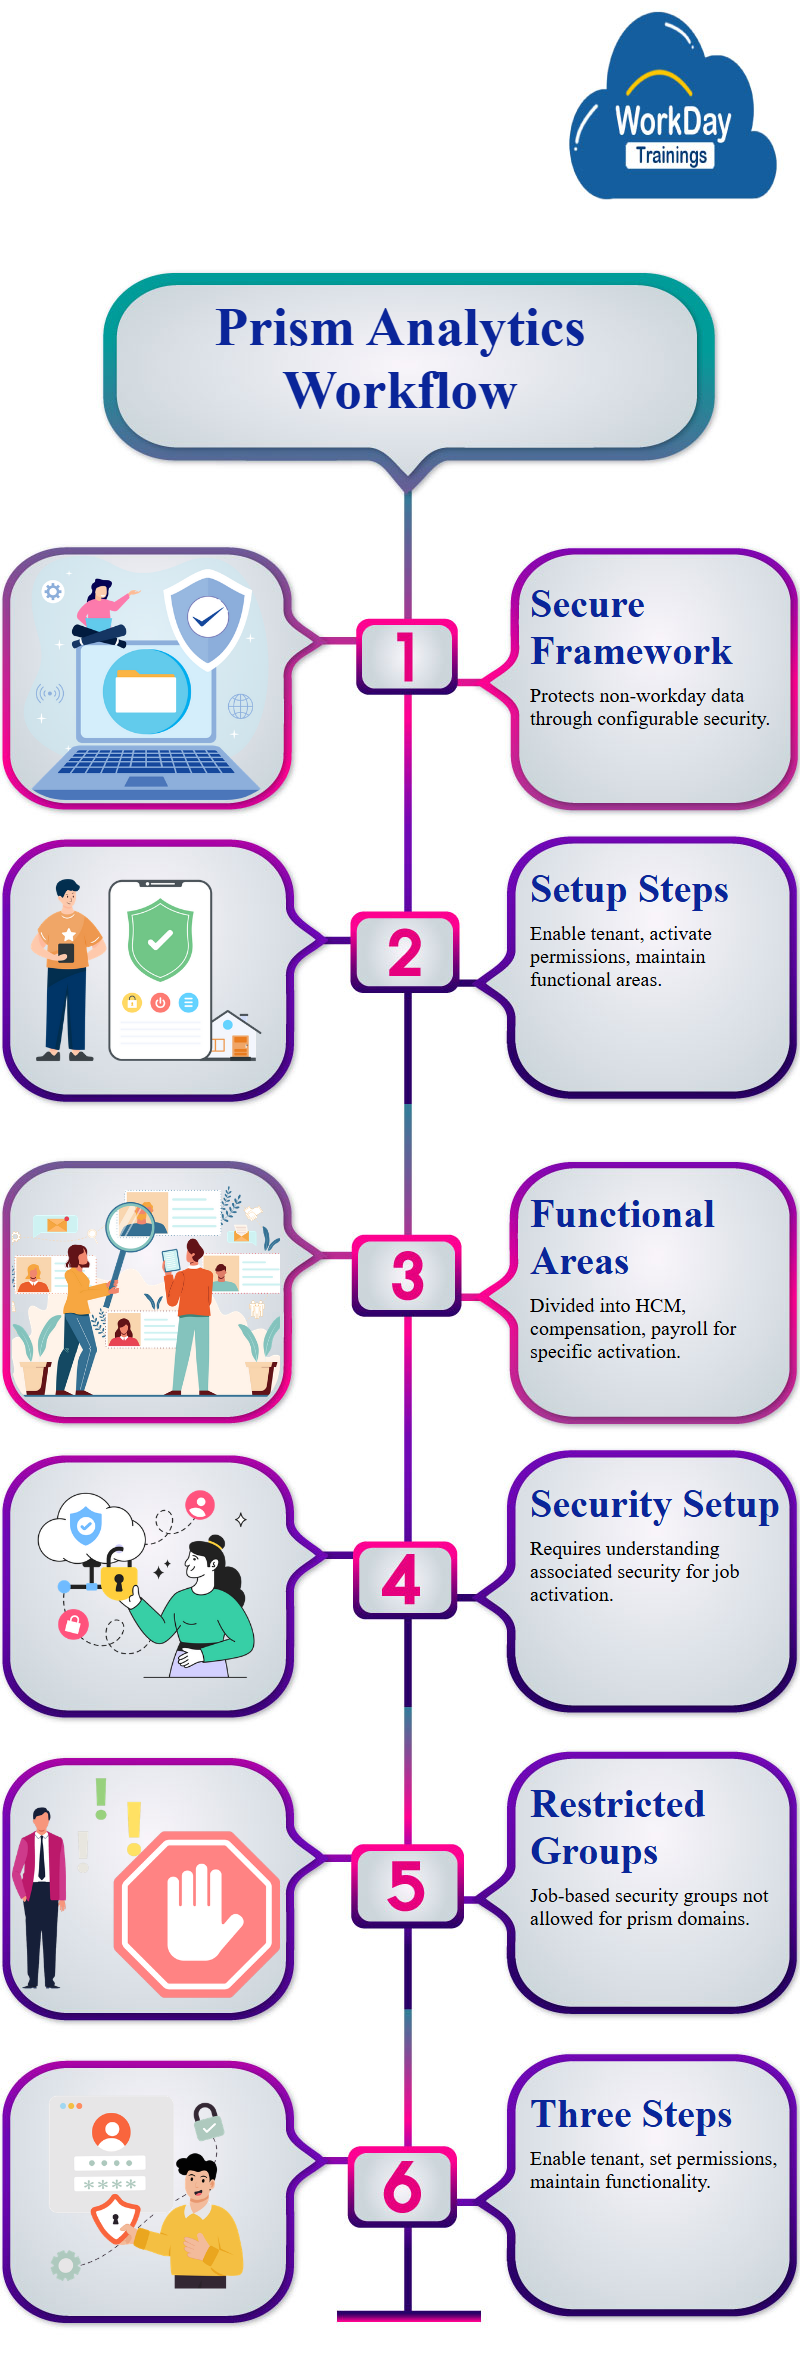
This process ensures that users have access to their own data sources and functionality, while also managing their own security setup.
The prism analytics data management workflow involves five steps: creating tables and base data sets, extracting data from workday and non-working sources, preparing data, applying security to the data, and applying security to the data.
It involves creating tables and base data sets in the workday prism demo environment, which is separate from workflow and workday, data can come from workday or external sources, and must be brought into the prism environment.
Prism Analytics Data Management: Securing and Managing Data Sources and Datasets
All security is applicable on the data source, and the data source security is a crucial aspect of prism analytics data management.
The process of creating a third type of data set, known as publish published data sets, involves defining the data and making it available for workday analysis, this is achieved by creating a data source, such as a prism data source, which is a Workday-delivered data source.
Data source applies the security defined earlier, controlling who has access to the data source, once the data source is created, it can be used to create reports and visualizations.
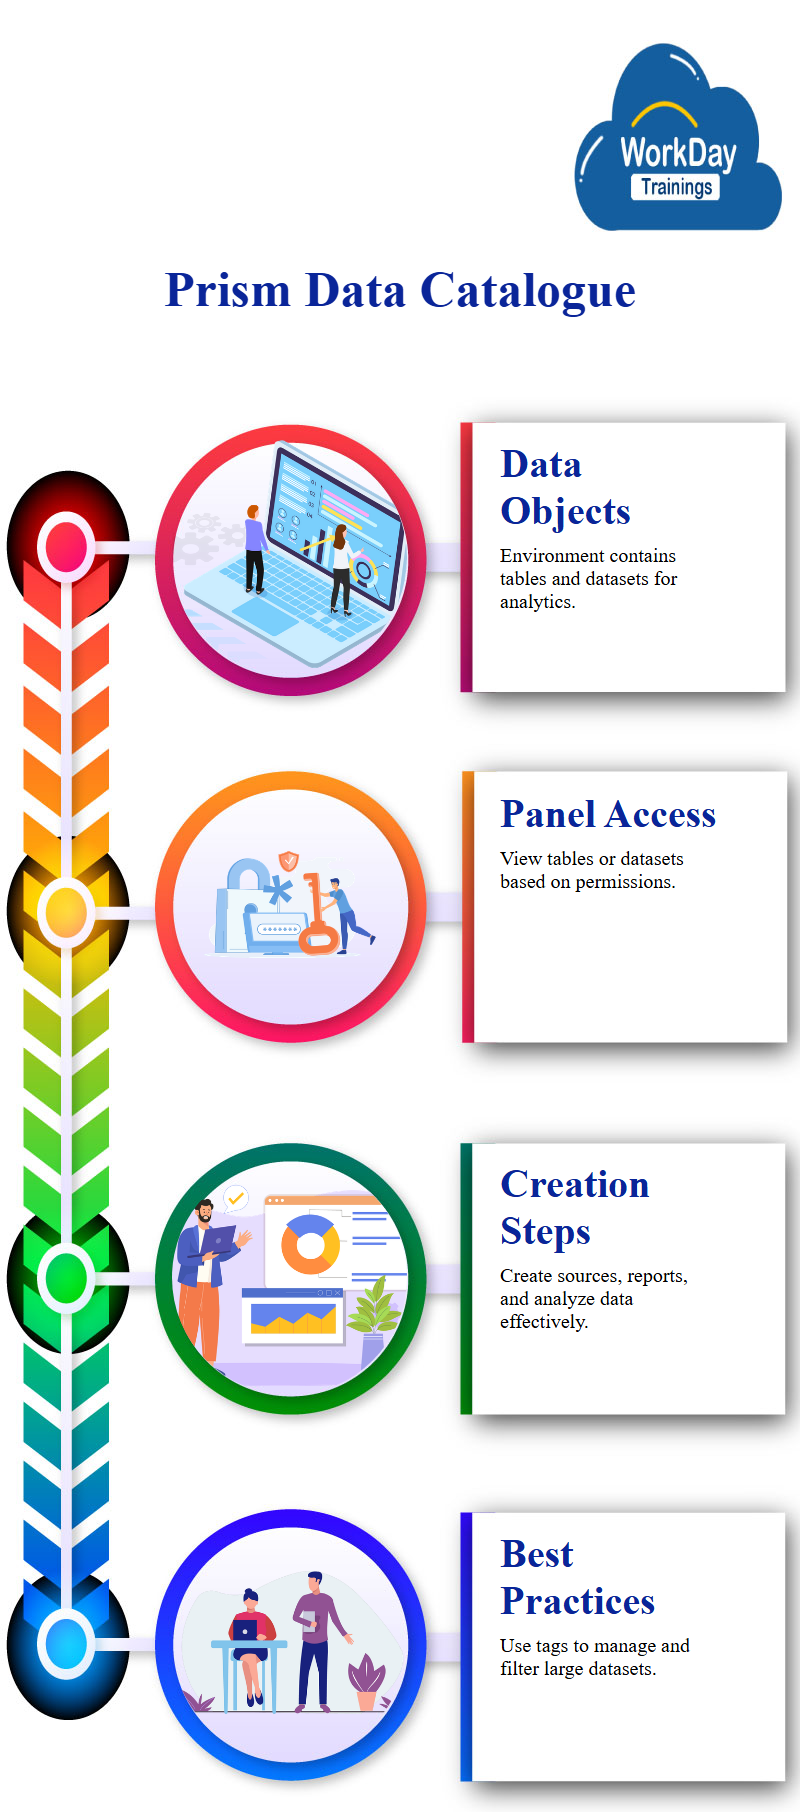
The prism environment within a tenant is a logically separate environment called the data catalogue, this environment consists of two objects: tables and datasets.
The data catalogue details panel allows access to all data, divided into object type views, users can view tables or datasets based on their permissions.
The data catalogue details panel is divided into different sections, with the object type view allowing users to view tables or datasets based on their permissions, allows users to view tables, datasets, or all data.
The process of creating a prism data source involves five steps: creating a data source, creating a data source, creating reports, and analysing the data.
The Prism Analytics setup allows users to create different objects to bring in data, including base datasets, derived datasets, and tables, these objects can be imported and transformed as part of the analytics setup.
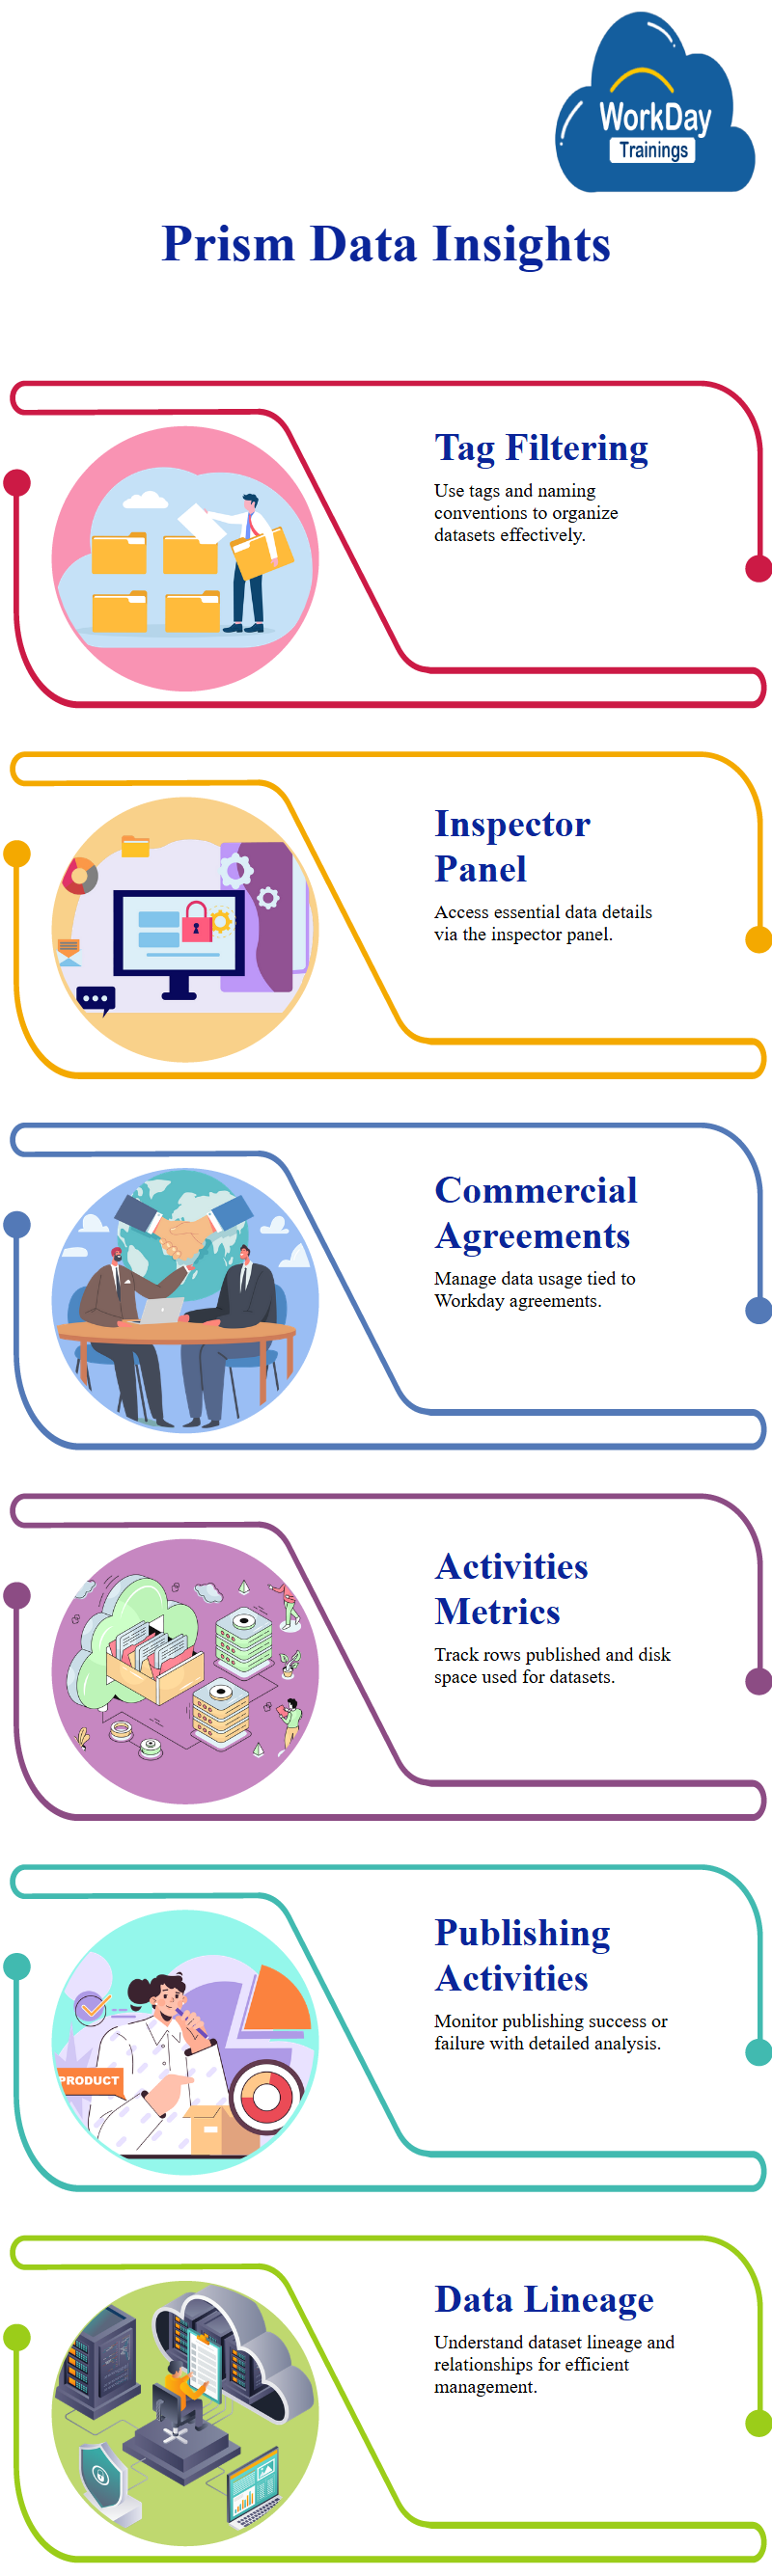
However, managing the large number of datasets can be challenging, best practices suggest defining tags for data or datasets and tables, which can be filtered on the tax, this is a two-way approach.
When a user clicks on an object, the system opens an inspector panel, which displays details such as the last modified date, description, security, and status of the data set, the associated tag shows all fields within the data set.
Users can filter by adding a tag to the object and giving relevant names for their data sets. Having a relevant naming convention and adding proper tags is crucial for managing data sets.
The inspector panel, source type, and imported by options are all essential for managing data in Prism Analytics.
Prism Data Usage and Commercial Agreements in Workday Data Catalogue
The data catalogue features an inspector panel, tag filter, table and data set lineage, and prism data usage, it is crucial for commercial agreements, as it allows users to return to the data catalog anytime, anywhere.
The activities button in the data catalog defines prism data usage, which controls commercial agreements with Workday, the metrics show the number of rows of data published and the amount of space used.
The total disk space used is 500 MBs, or 1.1 million rows, the activities tab on the data catalog shows the total disk space used for all data sources, including tables and data sets not accessible to users.
The total rows published summarizes the rows of data in all prism tables and data sets, including those not accessible to users, activities tab also shows publishing activities, including success and failure, and provides details for further analysis.
Understanding Data Sets in Prism Analytics
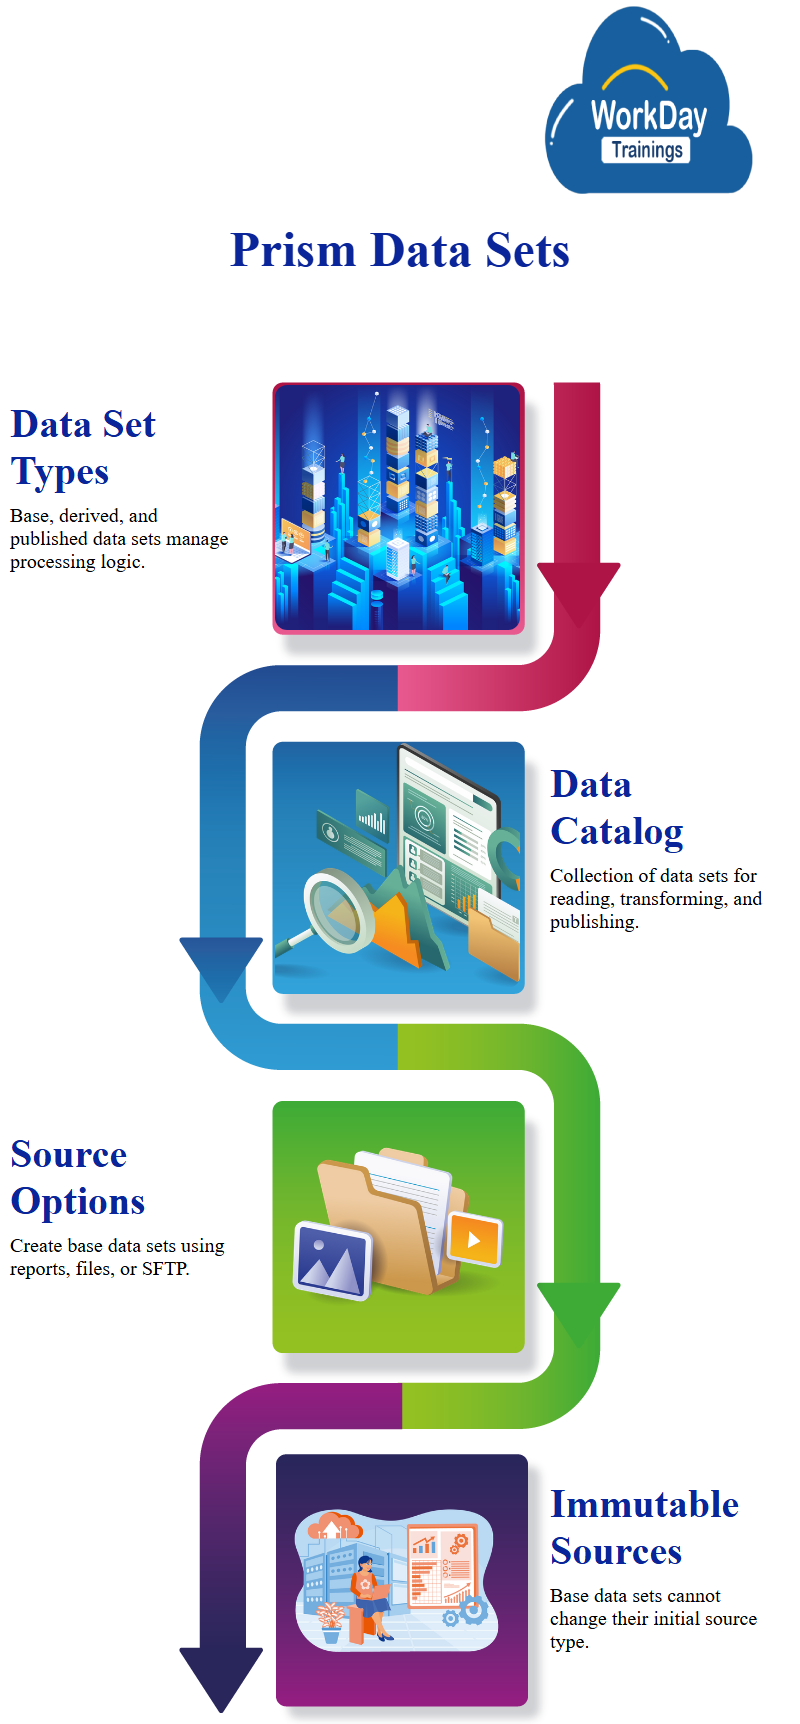
Data sets are objects in the prism analytics setup that control underlying data and describe the processing logic to transform or manipulate it, they can be base, derived, or published, a data set is also known as meta data, which is data about the data and defines the processing logic used to handle or manipulate it.
Creating Base Data Sets for Prism Analytics
The data catalog is a collection of data sets that are created to achieve specific purposes, these purposes include reading data, transforming and modifying data, and publishing the data set.
The data set is the base data set, which has downstream dependencies and acts as the starting point for data transformation, base data sets can be created through custom reports, files, or SFTP.
They are created to extract data from workday or external sources into the prism environment.
Creating a base data set requires using one source type, which can be either a custom Report or a file, a single source type can be used, but multiple source files can be used within that type.
For example, a base data set that extracts data from a custom report cannot be changed later, similarly, a base data set that extracts data from a file cannot be changed later.
A base data set in Prism analytics can be created from three different source types: workday custom reports, files, and SFTP servers, custom reports load data, while files are used for external data, an SFTP server is used for loading data through external data.
Prism Analytics Data Loading and Report Creation
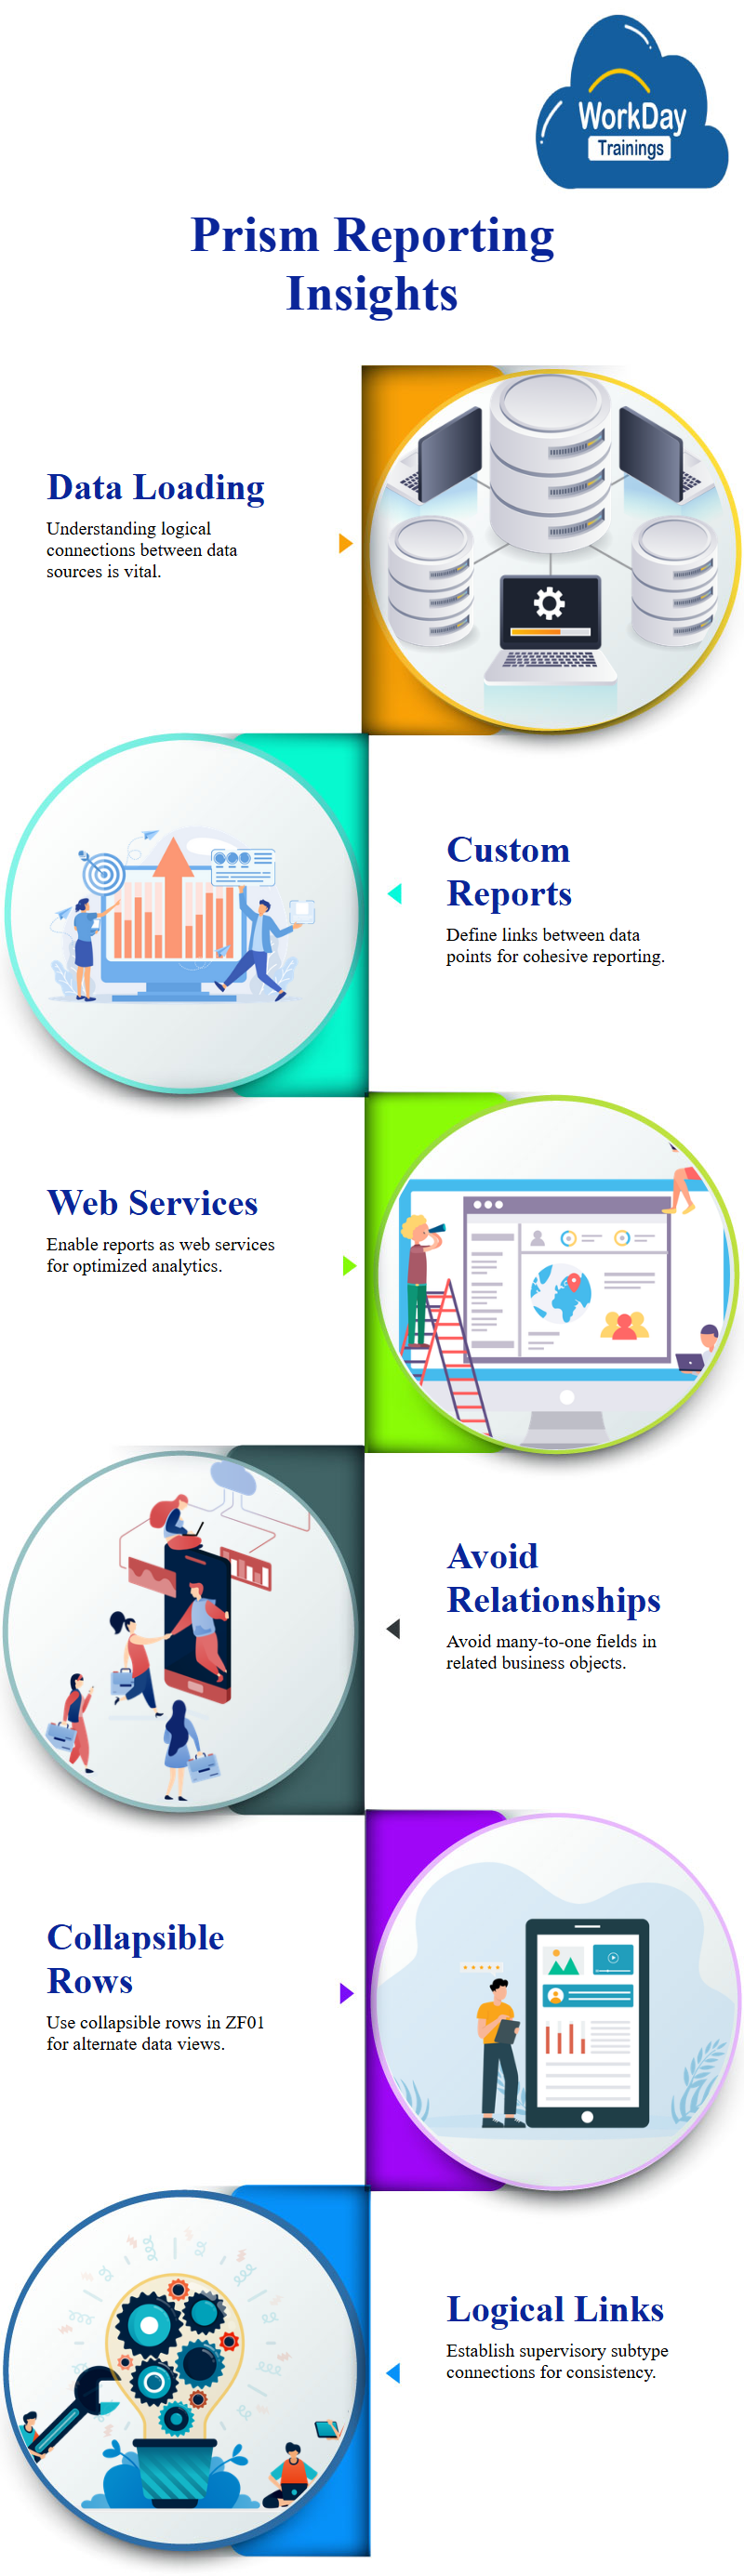
Understanding the data loading is crucial for Prism analytics workday configuration, understanding the data and the logical connections between different data sources is essential for working on it effectively.
The first report, ZF01, uses collapsible rows to show alternate columns and rows, understanding the data loading is essential for effective analytics in Prism.
Defining Common Links in Prisma Analytics Custom Reports
The second level custom report in Prisma Analytics is related to the first custom report by defining a common link between different data points, for example, EMEA, which is Energy, and human resources, which is also Energy, are all part of the same company.
The link between these data points is the sector of a company matching the subtype of the supervisory.
Optimizing Prism Analytics Reporting: Enabling Web Services and Avoiding Many-to-One Relationships
For prism analytics, the report should be enabled as a web service and not include any fields from an RBO related business object with a many-to-one relationship with the primary business object.
For example, adding a multi-instance field like addresses from a worker can be done directly on the primary business object, but it may not workday work because it includes a field from a related business object with a one-to-one relationship with the primary business objects.
Ensuring Currency Differentiation in Prism Reports
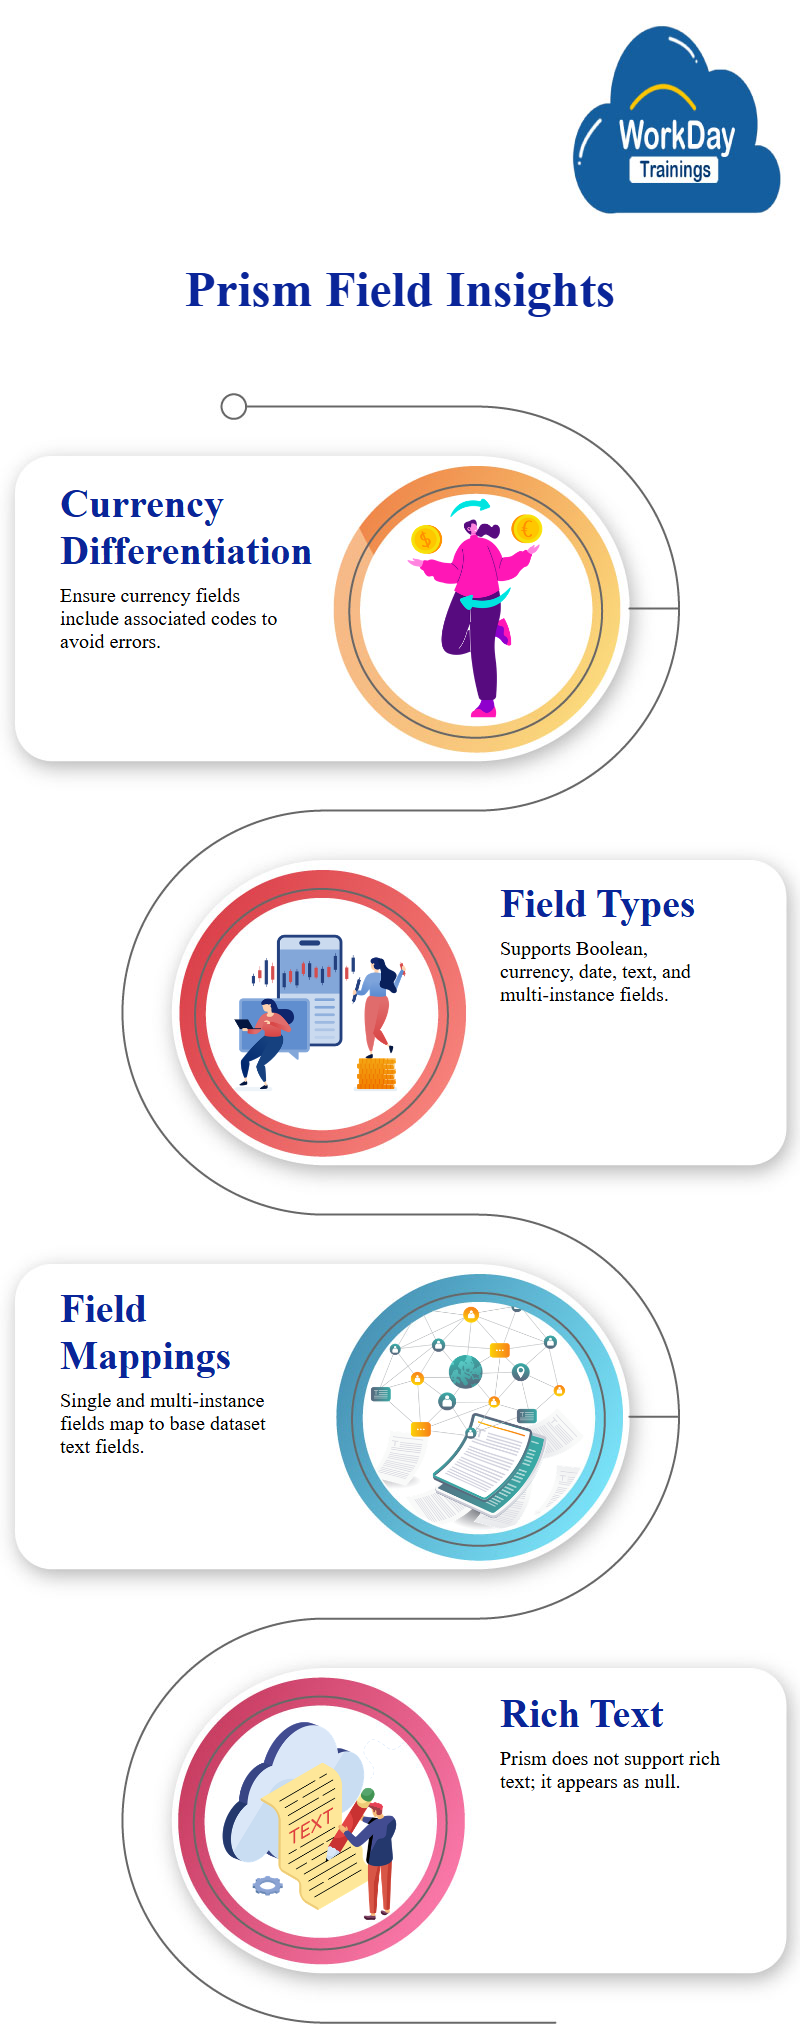
If your custom report includes a currency field, you must select the show currency column checkbox, if you remove this option, you may get an error saying that the report is enabled for prism but does not contain a currency field.
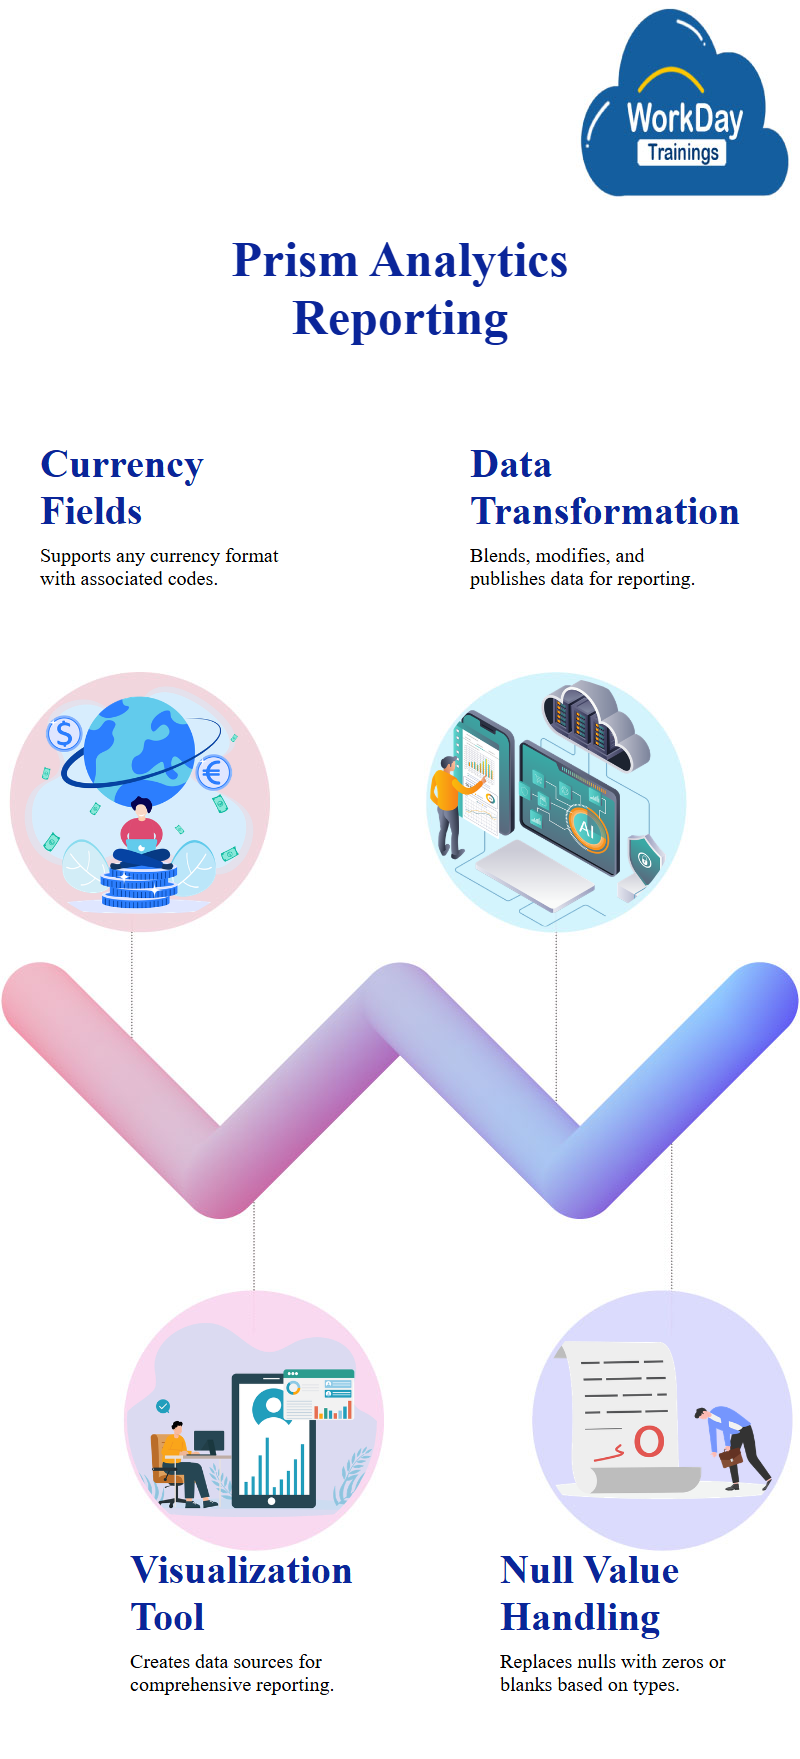
In prism, it needs to differentiate between your normal numeric value and your currency value with the associated currency code.
Prism Analytics Field Types and Custom Report Categorization
Prism workday analytics supports various field types, including Boolean, currency, date, text instance, and multi-instance, in custom reports, these fields are categorized into text, number, numeric, date of birth, and currency, however, Prism workday analytics does not support all of them.
Field Mappings and Rich Text Support in Workday and Prism Analytics Reports.
Workday reports have single instance and multi-instance fields, while Prism Analytics has multi-instance and instance fields, a single instance field is mapped to a text field in the base data set, while a multi-instance field is mapped to a text field in the base data set.
It also supports rich text, which allows for formatting in job profiles and comments. However, Prism Analytics does not support rich text.
Instead, it maps date to date, which is supported in Prism Analytics, when creating a base data set, rich text will appear as null.
Data Analysis and Visualization Tool
Prism Analytics allows for the use of currency fields in custom reports and external data as long as they have a code, “Show currency column” check is used to identify currency fields, and any format is supported as long as there is a currency code.
Workday processes data from custom reports into a data set, which is then manipulated and transformed into a base data set, published into a Prism Data Set (PDS) for reporting, all reporting in Workday happens through a data source, which is used for all reporting.
The purpose of Prism Analytics is to bring data from different sources, blend, transform, and modify it for reporting purposes, once a Prism Data Source is created, it can be used for reporting.
It is a data visualization tool that creates a new data source called the prism data source when a data set is published, data source is used for reporting and is initially created with null values.
However, when reporting, there is no concept of a null value, replaces any null values in the published data set based on the field type.
Initially, the base data set has null values, which are then migrated to the derived data set, when publishing the derived data set, it replaces all null values in the published data set.
Null values can be in Boolean, currency, numeric, or long fields, the system calculates age as zero when the user is born or less than one year old.
When publishing the final data set, all null values are dealt with, numeric values are replaced with zero, and instances, text, or multi-instance fields are replaced with blank values, for instance supervisory jobs, null values are replaced with zero.
Re-importing Data with Prism Setup
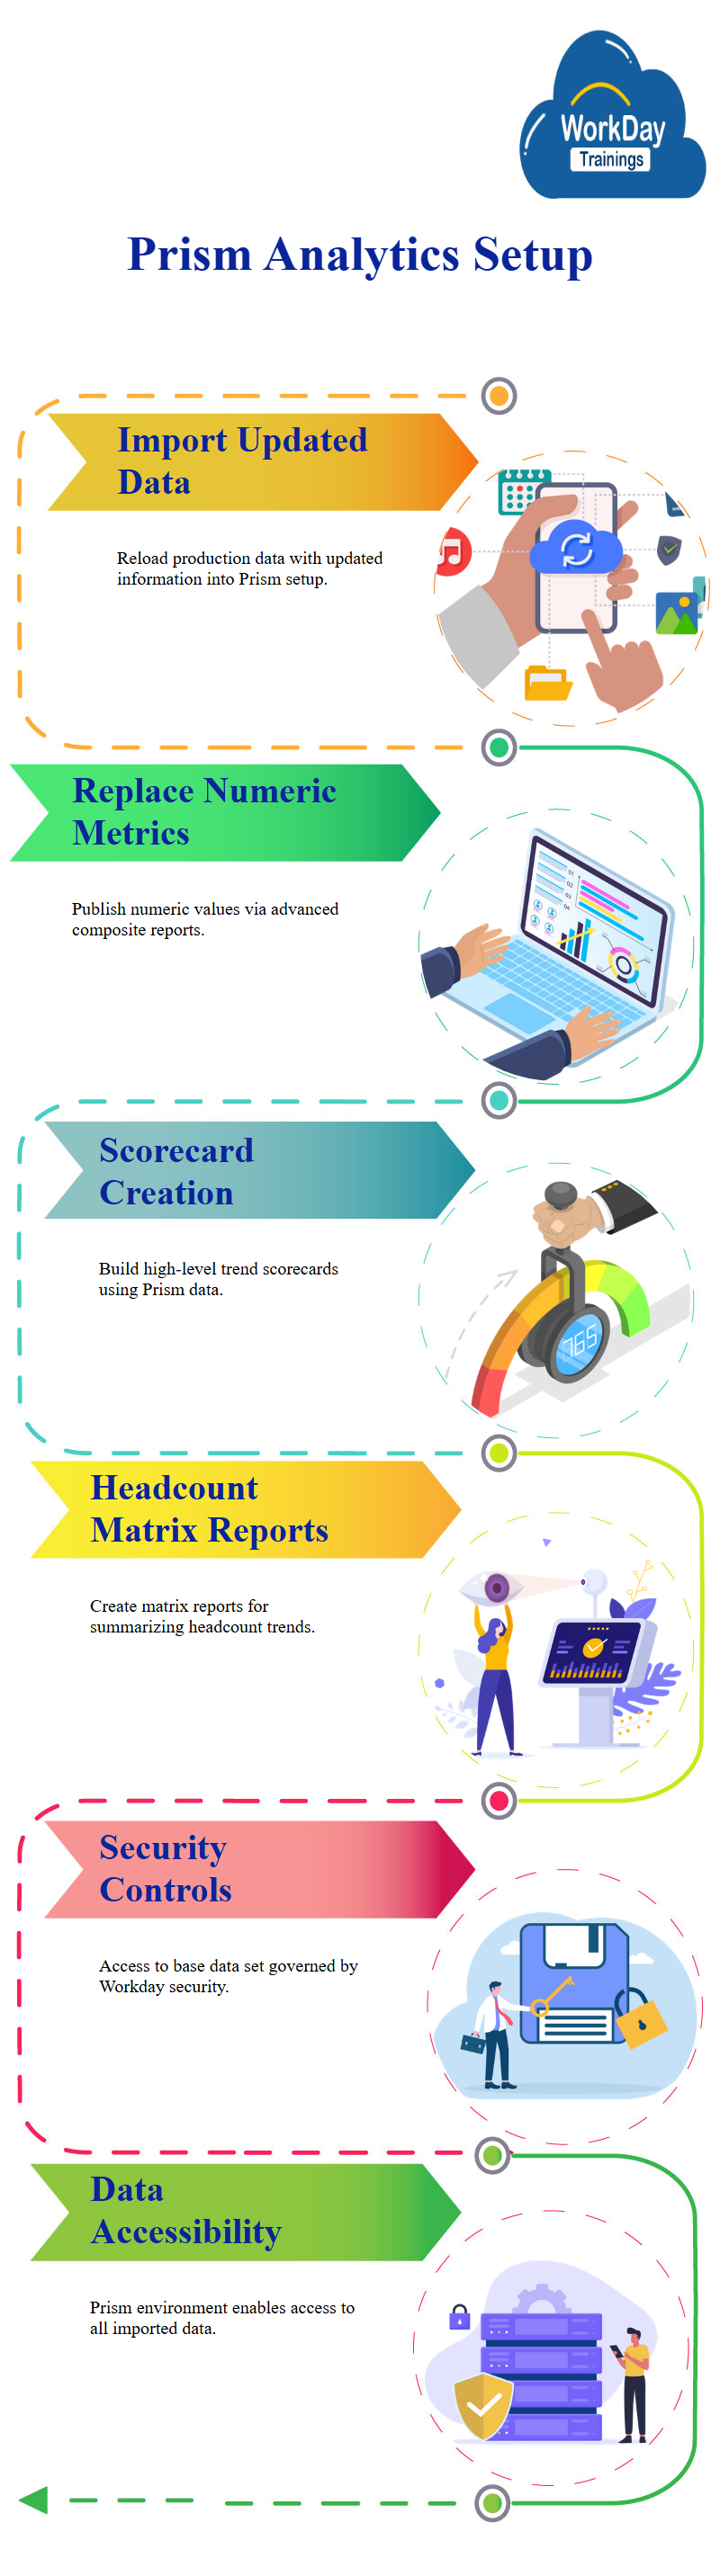
To re-import data, users can add a manage field stage and save the changes, this ensures that the latest data from the production system is automatically reloaded, if the data set has been updated with new information, the data should also be included in the prism setup.
Numeric Values in Prism Analytics
In Prism workday analytics, numeric values are created instead of having values like males, females, or additional jobs, these metrics are then published through advanced composite reports, which provide headcount trends.
Scorecard Creation with Prism Data
To create scorecards, clients need to provide data in Prism for building them, scorecards are high-level trends, summarizations, and can only be used for specific values.
For example, to count headcount, a matrix workday Report can be created by adding one matrix and adding any number of metrics.
Prism Security and Data Sharing in Workday Analytics
Workday security is important in Prism workday analytics, as it becomes a data feed into scorecards, when a custom report is created, only those with access to the base data set can see the data.
However, when the data is brought into the Prism environment, all data can be accessed, even if the end user does not have access to the data set.
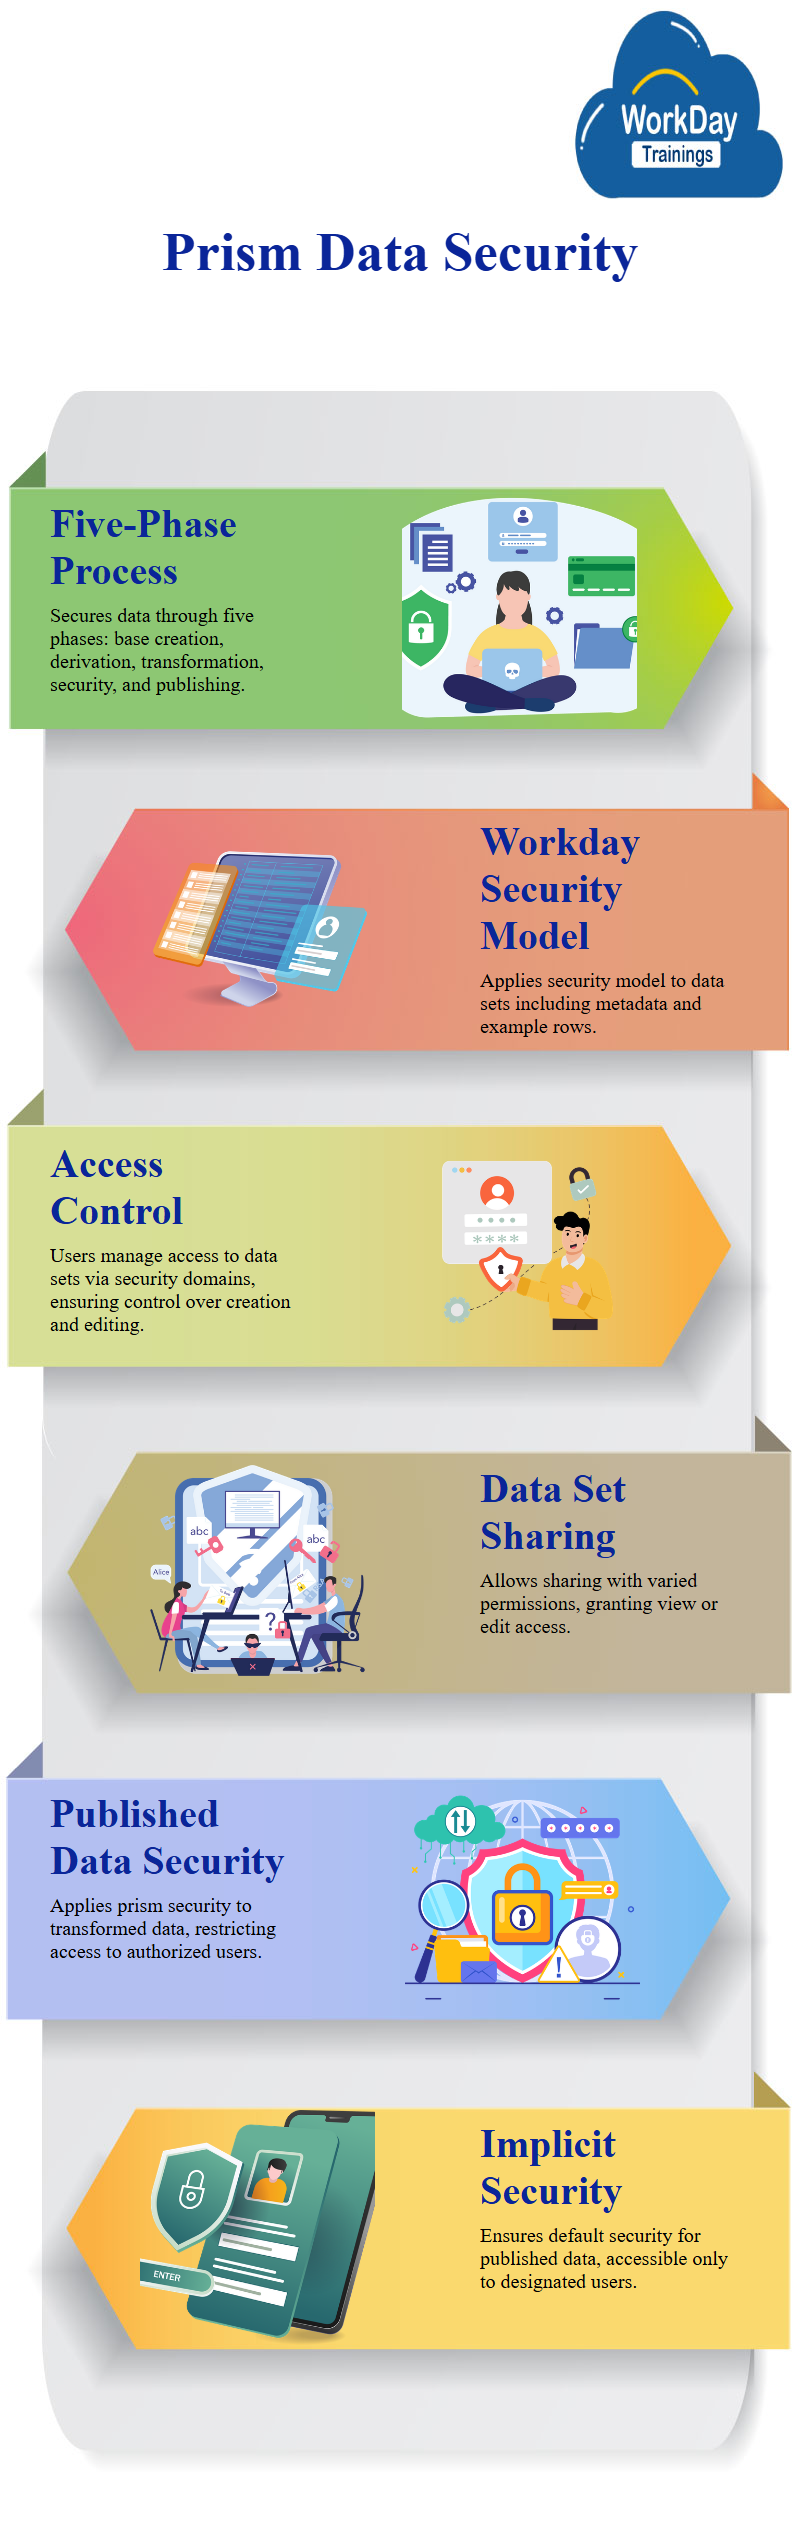
Prism security is a five-phase process that involves securing data in a data set, it involves creating base data sets, creating derive data sets, transforming data using derive data sets, applying security, publishing data, and analyzing data.
It applies the workday security model to each phase, focusing on creating and editing data sets, a data set includes metadata, such as table schema, field type, order, and format, and a subset of data, such as example rows.
Only those with access to the data set can access both metadata and data rows, to control access to the data sets, users can use security domains to create, edit, or manage data sets.
However, controlling access to the data within the data sets is not possible in a data set base and derive data set, unlike in a report, which has contextual security access.
Data set sharing is a crucial aspect of data management in Workday access to a data set is unconstrained, meaning that any user who can view or manage it can view all fields and data.
It removes all security domains configured on the business object of the report, so the only way to control access is by controlling who has access to view, create, or manage the data set.
Data set sharing allows users to share the data set with others in view or edit mode, granting different levels of permissions, allows users to grant access to view, modify, or view the data set.
Securing Published Data in Workday with Prism Data Source
Another aspect of data management is applying security to the published data, when you apply security restrictions on the data set, creates a data source, which applies the restrictions to the data source.
This ensures that data has the proper restrictions when viewed in a report, and the restrictions are only applicable to the report.
It applies this security to the published data in the form of a prism data source, which allows users to view the data through various visualizations, if you don’t apply security to your DDS01., it’s essential to ensure that the security framework used in your workday project is in place.
The process of publishing a data set in Workday, which applies an implicit security called Prism default to data set access, this security is applied to the data set, ensuring that only those with the underlying data set access can access the data source.
It creates a prism data source, loads it with the transformed data, and applies the appropriate security restrictions, if no explicit security has been applied, applies the implicit security using domain Prism default to data set access.
This means that only those with the underlying data set access, which was published, can access the data source, the implicit security applies only to those who have the data set access.
Once the security is applied, the data source can be accessed and reports can be created, the material emphasizes the importance of having explicit security applied to ensure the security of data sets.
Prism Calculate Fields
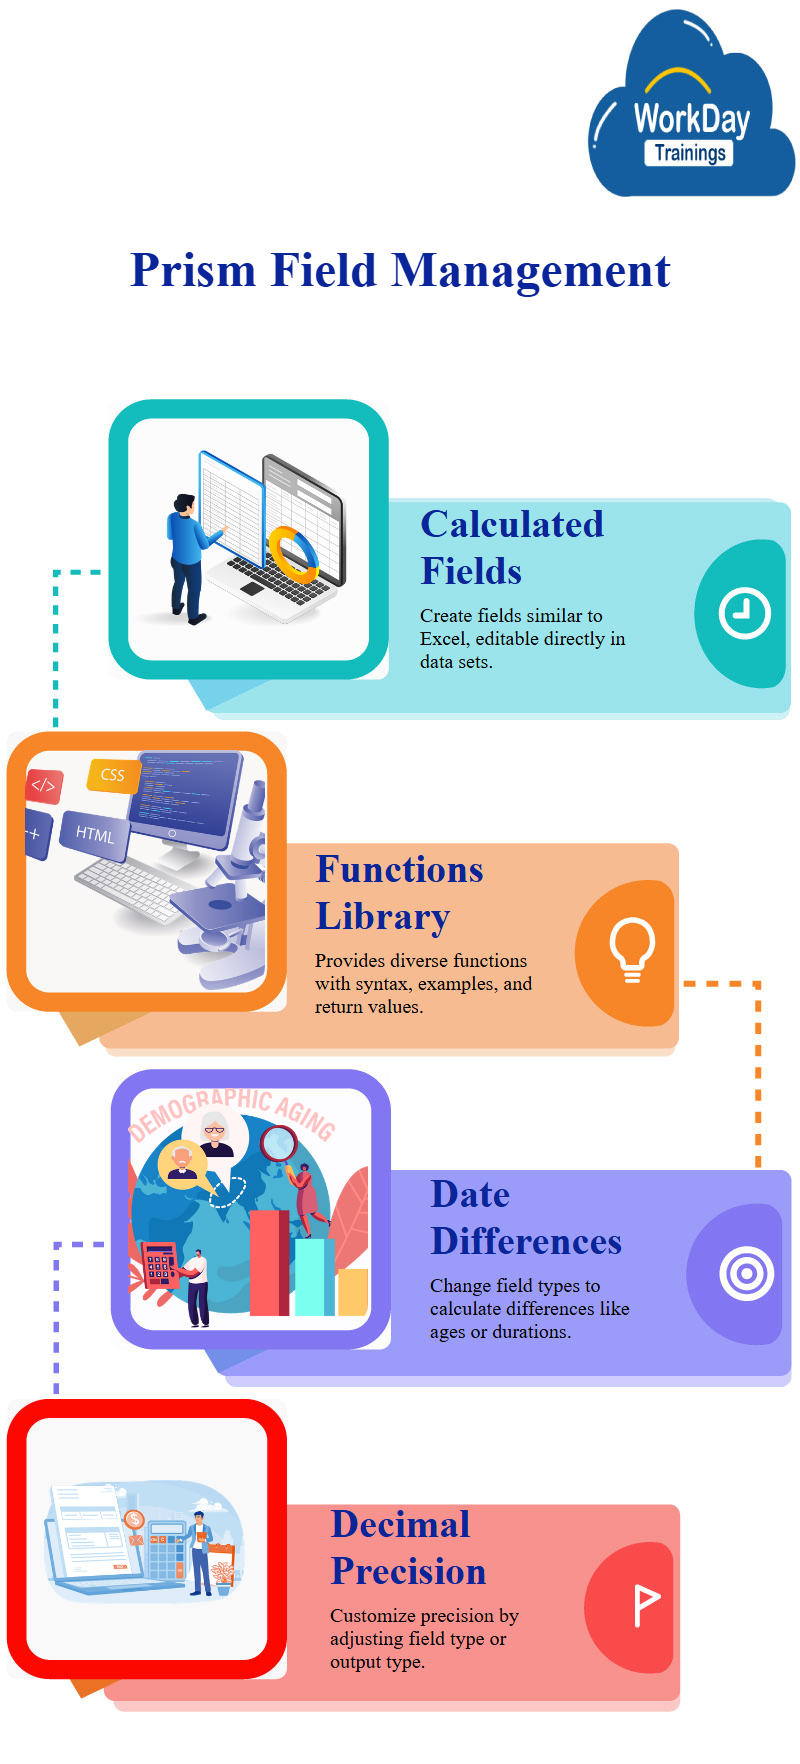
Prism calculate fields are available in the system, which are similar to how they are created in custom reports Excel calculations, these fields can be added to data sets and are similar to how they are created in Excel.
For example, if the data set is complete, users can edit it by clicking on “+” to add a new field.
Functions Library for Calculated Fields
The functions library displays different functions for creating workday calculated fields examples, including date difference, hours, milliseconds, minutes, seconds, and years, each function has a separate description, syntax, example, and return value.
The return value is determined by the type of field and is displayed in the function’s library.
Changing Field Types to Find Date Differences
To find the difference between two dates, you can use a managed field stage to change the field type, for example, to find the age difference between the date of birth and the higher date, you can add a square bracket and select the desired field.
The system will automatically show you other functions and descriptions.
Customizing Decimal Precision in Manage Stage
To change the decimal precision, you can add a new manage field stage and change the output type or field type to numeric, however, the return type or year difference will always be double.
Workday functionality in Fields
To search your fields, you can directly go to the org level from top, this will show all the organization levels, including the top-level organization, business lines, hubs, divisions, and departments.
The organization structure can be structured into different departments, groups, and teams, with the head office at the top.

Harsha
New Technology, let's explore together!

