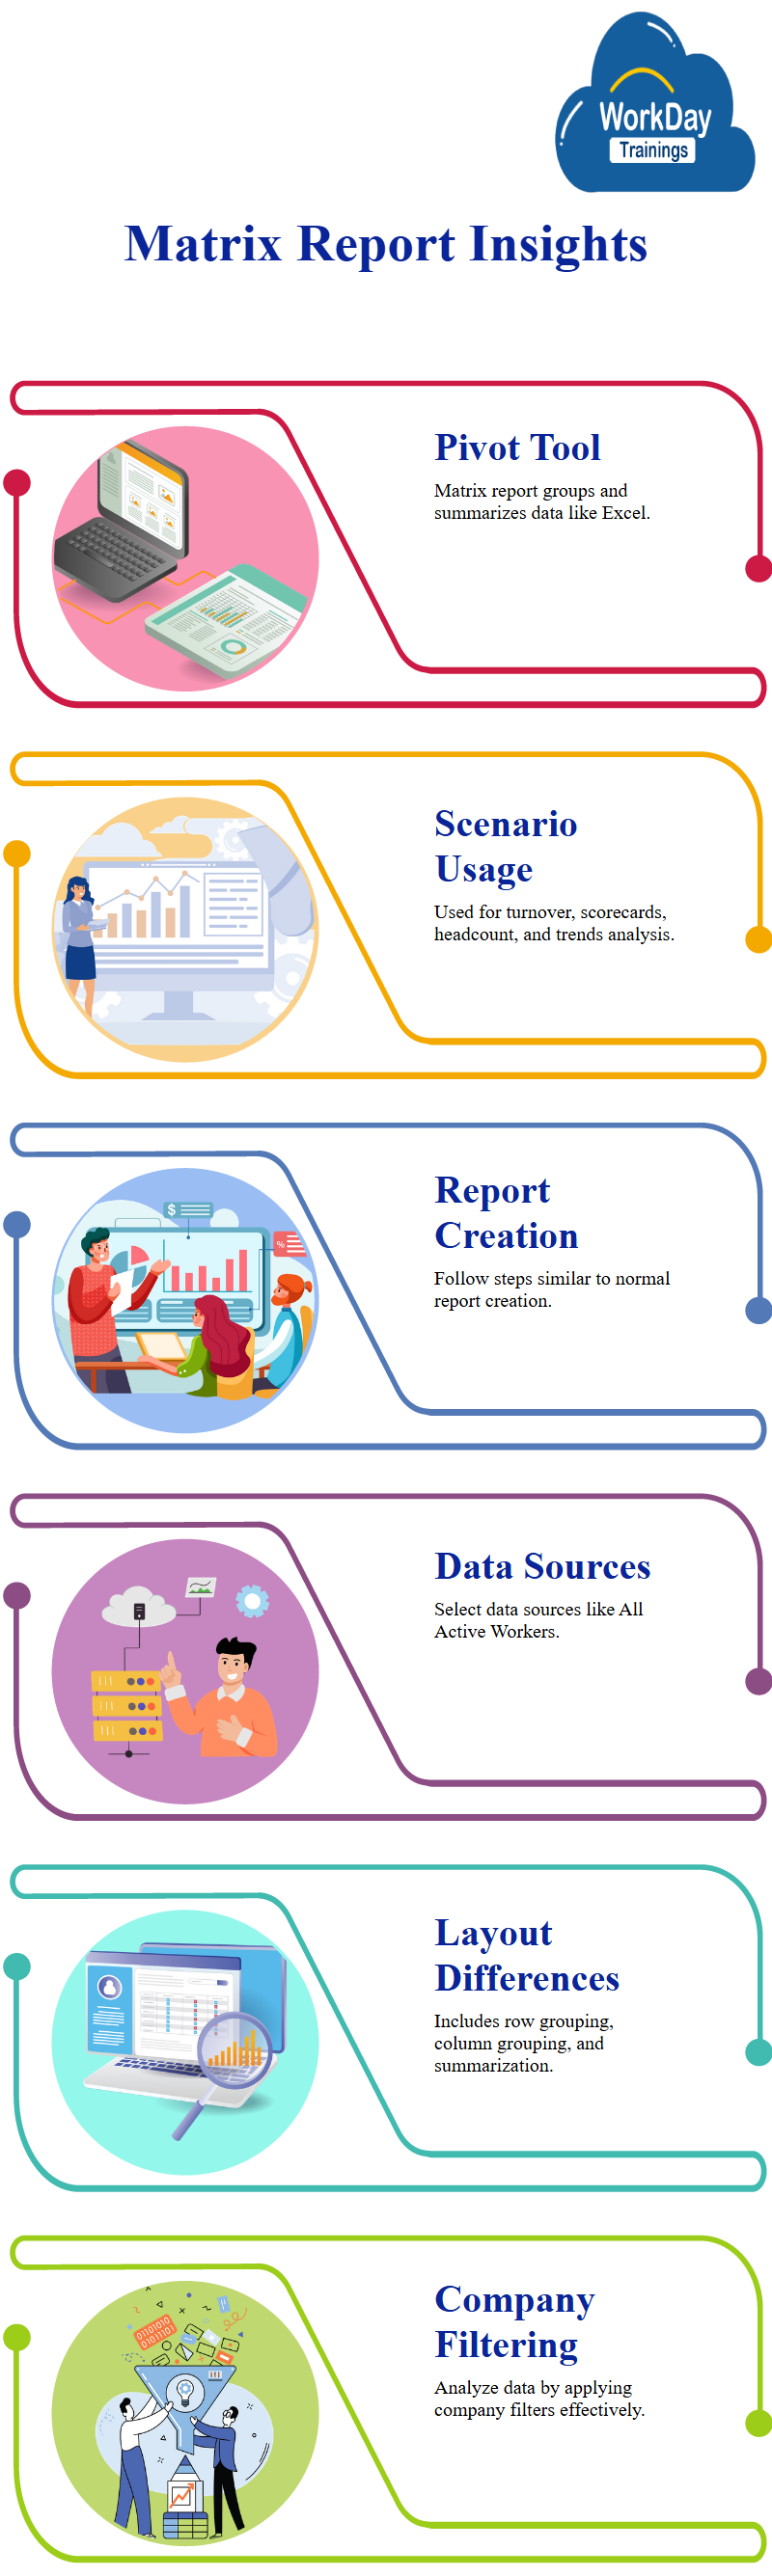
A matrix Workday report is a pivot-like tool used for groupings and summarizations, providing aggregated values similar to Excel. It is the foundation of advanced d-cube analytics in Workday, including composite reports.
Matrix workday reports are used for various scenarios, such as turnover rate, scorecards, headcount, termination trend, and higher trend workday analysis.
To create a matrix report, follow the same steps as creating a normal report, select a data source that is similar to the advanced report, such as All Active and Terminated Workers.
The layout of a matrix report differs from that of an advanced workday Report, with row grouping, column grouping, and summarization types.
A report that aims to analyse the data of insight global salary modern services companies by filtering and adding a filter company.
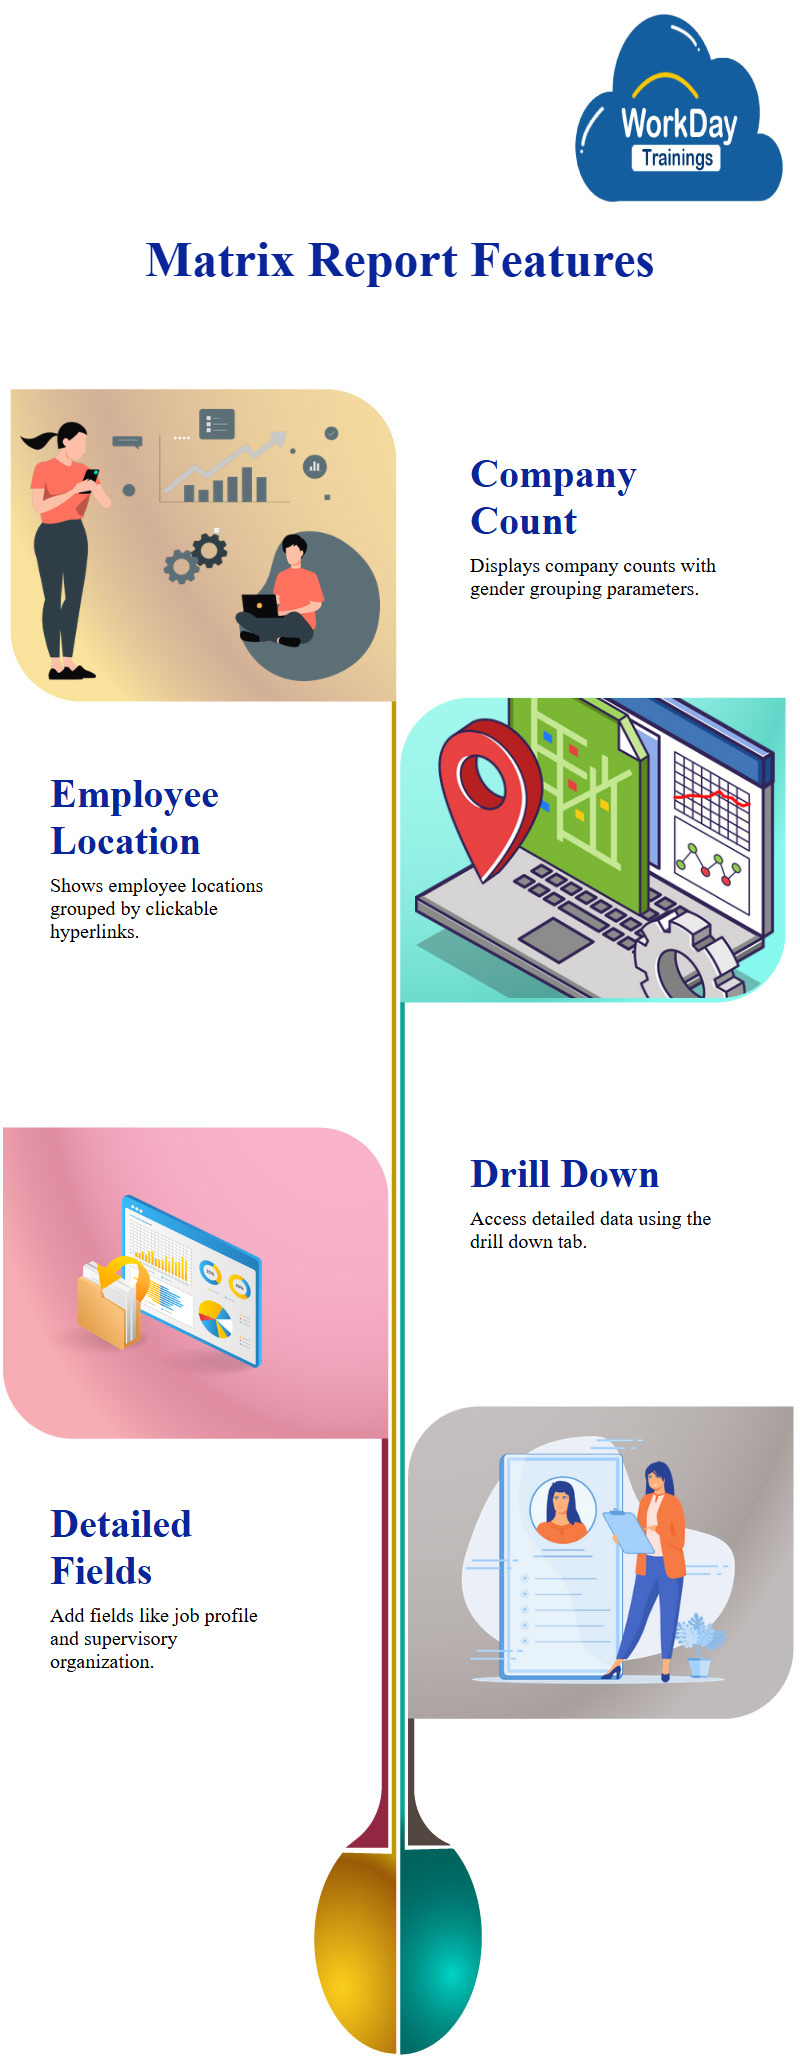
The report then presents various companies in rows, with a count for each company and a grouping parameter for gender, the report can be edited to include larger companies with larger populations, such as GMS Australia and ABC.
The report also shows the location of each employee in different countries, such as Sweden and UK, the data is then grouped into hyperlinks, which can be clicked on to display additional details like name, position, higher, job, and workday manager details.
However, the report only displays groupings and summarizations. To obtain detailed data, the user can use the “drill down” tab in the report.
The detailed data section in a matrix report allows users to add various fields, such as job profile, position, and workday supervisory organization.
However, the overall output remains the same due to no changes made on the matrix tab, the detailed data section also provides high-level summarizations, groupings, and metrics.
Filtered Views in Reporting
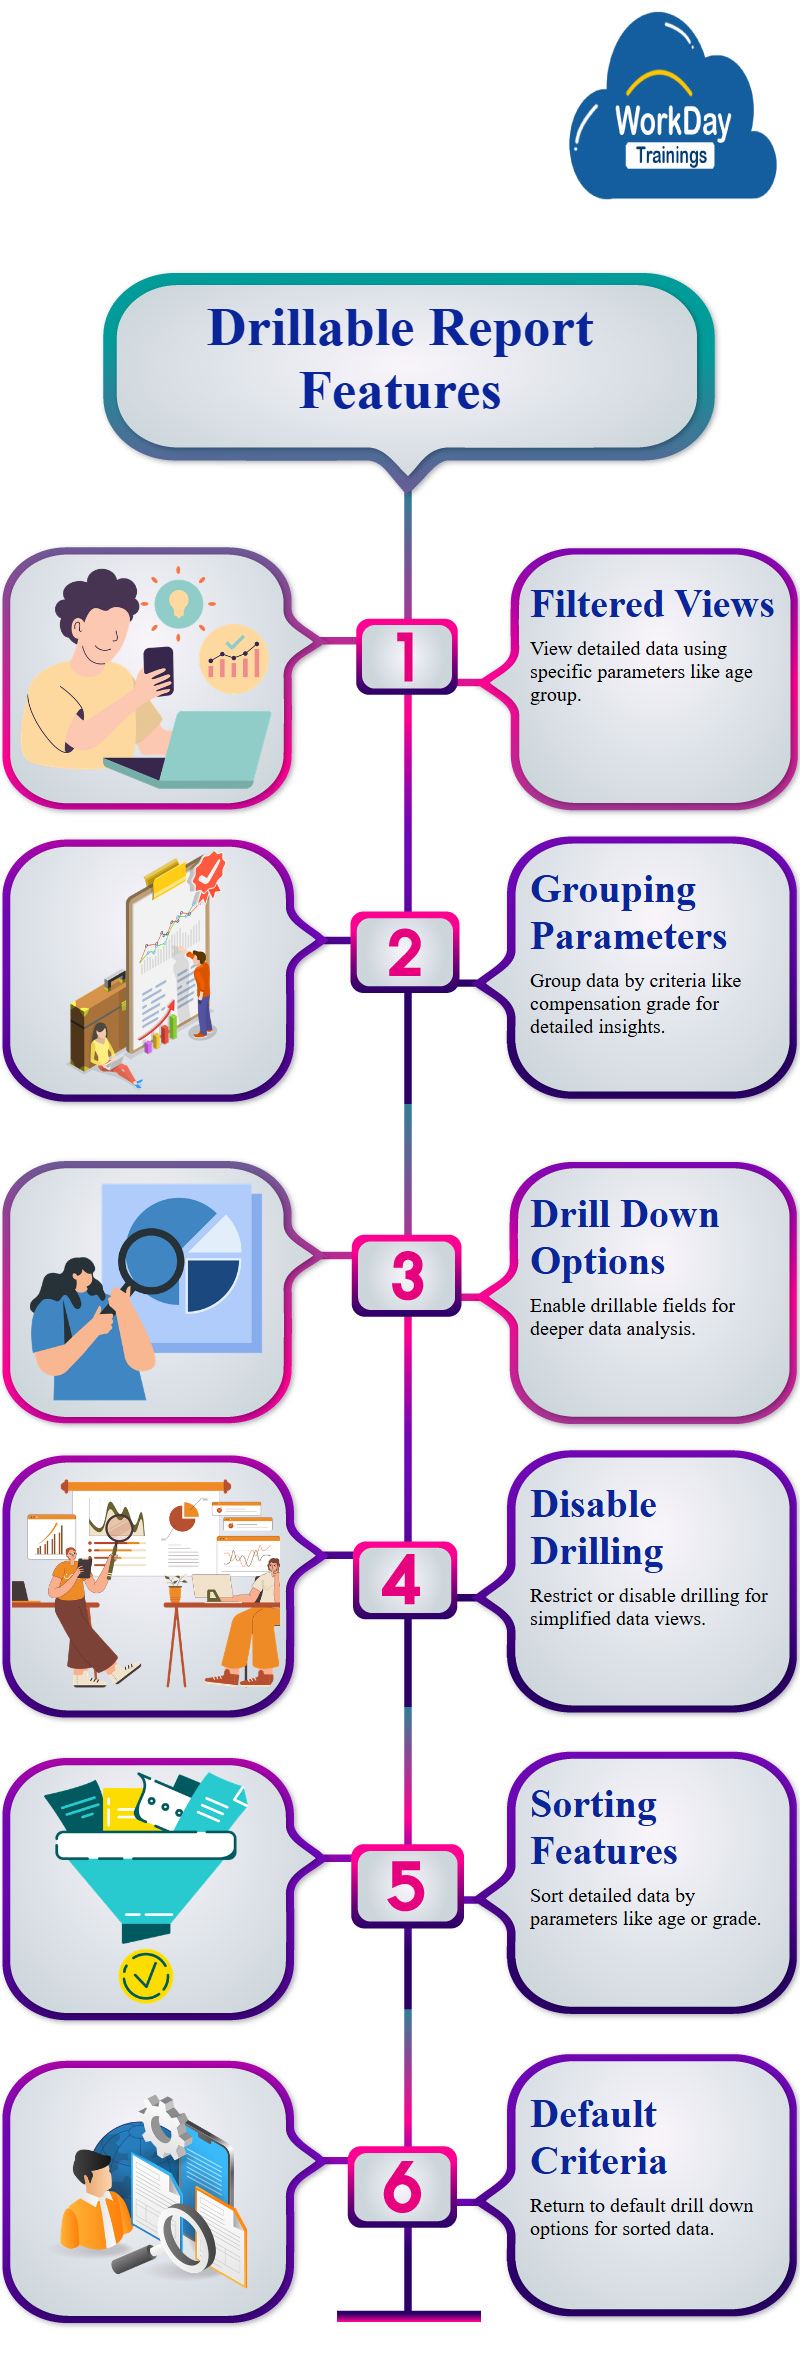
A view by criteria section allows users to view detailed data based on specific parameters, such as age group.
The grouping parameters can also be viewed by selecting the workday compensation grade, for example, if 29 workers are in non-management grade, users can view their details by selecting the grade and refreshing the report.
Drillable Report Updates: Streamlining Data Analysis
The report has been updated with detailed data, drill down options, and drillable fields, the drill down values is automatically added by the data source.
To restrict the drill down values, the user can select specific drillable fields, such as age group, compensation grade, and management level.
To sort data, the user can select a view by options option and disable all drilling for the report, the second option, disable drilling to details, is also available under drill down. Users can select this option and run the report.
Hiding Drill Down Criteria in workday reports
The grouping parameters are drillable parameters, but they cannot be hidden, to hide the criteria, the user can disable the entire drilling, users can then go back to the default drill down options and see the detailed data, sorted based on age.